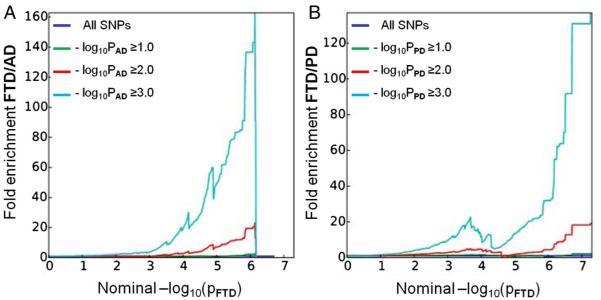
Figure 1.
Fold-enrichment plots of enrichment versus nominal −log10 p values (corrected for inflation) in FTD below the standard GWAS threshold of p<5×10⁻⁸ as a function of significance of association with AD (A) and PD (B) and at the level of −log10(p)≥0, −log10(p)≥1, −log10(p)≥2 corresponding to p≤1, p≤0.1 and p≤0.01, respectively. Blue line indicates all SNPs. AD, Alzheimer’s disease; FTD, frontotemporal dementia; GWAS, genome-wide association studies; PD, Parkinson’s disease.

