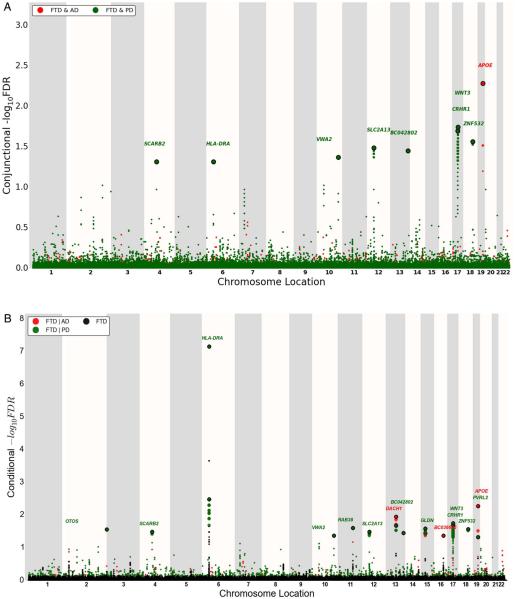
Figure 2.
‘Conjunction’ (A) and ‘conditional’ (B) Manhattan plots of conjunction and conditional −log10 (FDR) values for FTD (black) and FTD given AD (FTD|AD, red) and PD (FTD|PD, green). SNPs with conditional and conjunction −log10 FDR>1.3 (ie, FDR<0.05) are shown with large points. A black line around the large points indicates the most significant SNP in each LD block, and this SNP was annotated with the closest gene, which is listed above the symbols in each locus. For additional details, see online supplementary information. AD, Alzheimer’s disease; FTD, frontotemporal dementia; LD, linkage disequilibrium; PD, Parkinson’s disease.

