
Figure 2. Reproducibility of Protein Identification.
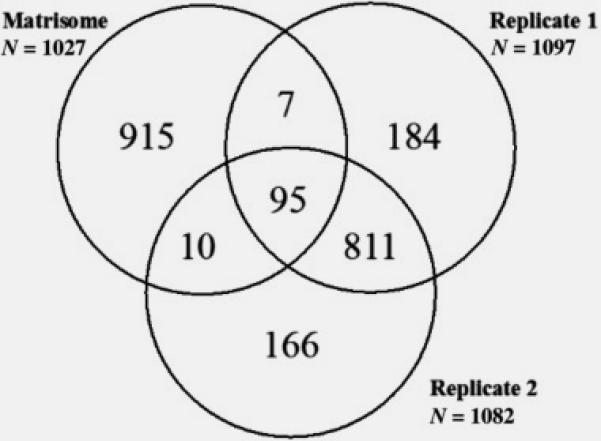
A comparison of protein identification rates within technical duplicate LCMS samples is shown in a Venn diagram. While the total numbers of identified proteins is consistent within a LCMS run, the numbers of unique proteins identified within only Replicate 1 or only Replicate 2 equaled approximately 20% of the total. To define the matrix protein identification rate, replicate 1 and 2 were each compared to the proteome contained in the Matrisome database. Replicate 1 (n= 1097 total proteins), Replicate 2 (n= 1082 total proteins), and the Matrisome database (n= 1027 matrix proteins).