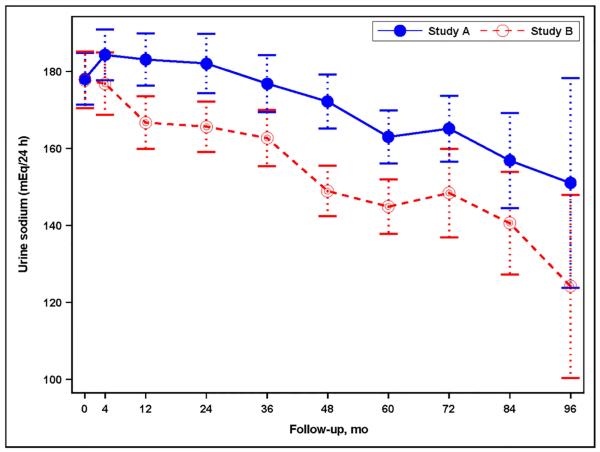
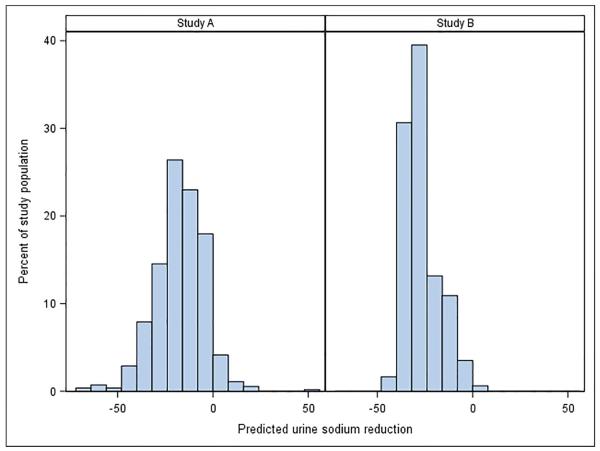
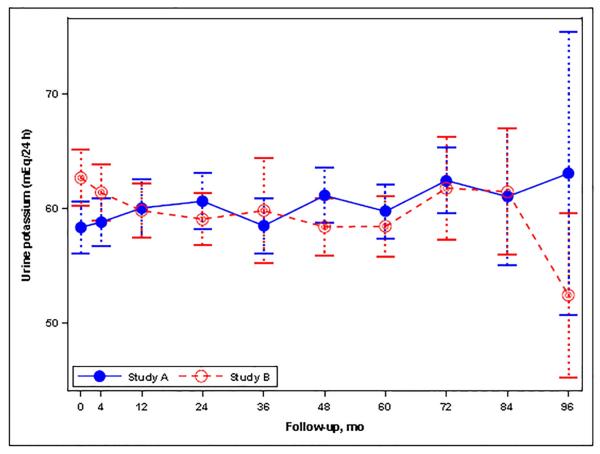
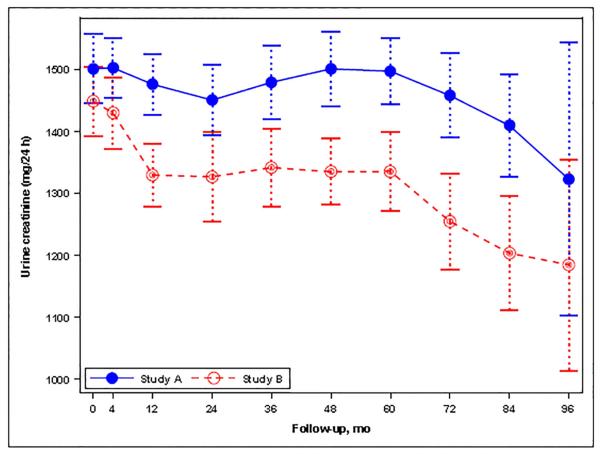
Figure 1.
(A) Graph showing the mean urine sodium excretion in the Study A and Study B participants during the trial; I bars indicate 95% confidence intervals. (B) Histogram for the change in urine sodium excretion from the baseline to the last study visit (mEq/24 hours) in Study A and Study B patients as percent of total patients in each study. Changes were estimated from a linear mixed model with predictors for year, year-by-study drug, and year-by-blood pressure arm. (C) Graph showing the mean urine potassium excretion in the Study A and Study B participants during the trial; I bars indicate 95% confidence intervals. (D) Graph showing the mean urine creatinine excretion in the Study A and Study B participants during the trial; I bars indicate 95% confidence intervals.


