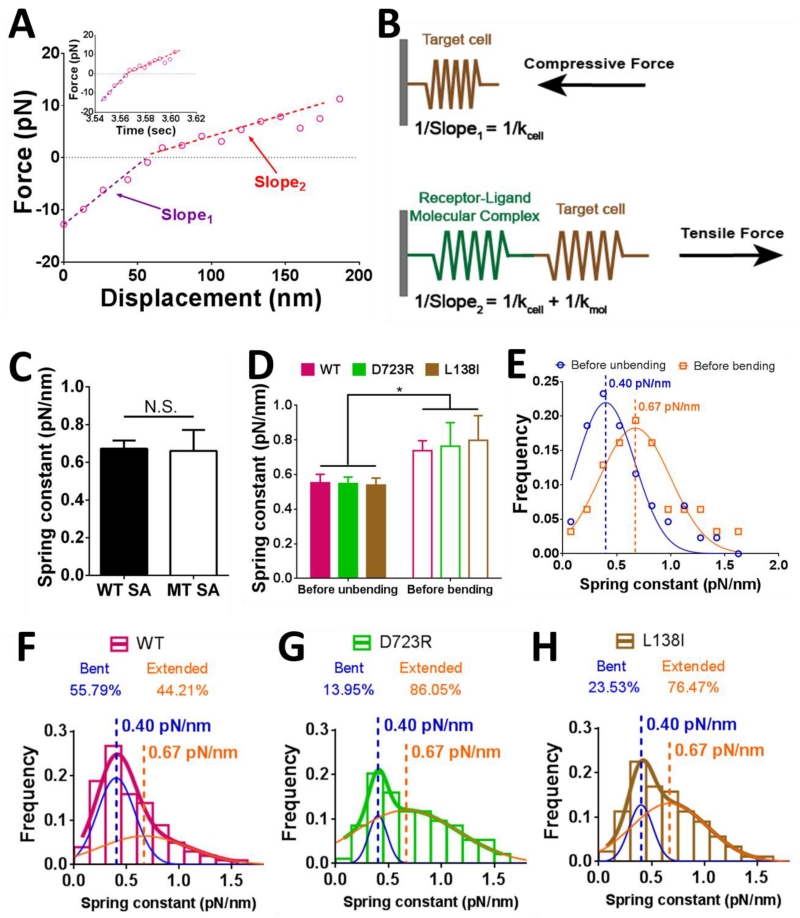
Figure 4.
Determining the molecular stiffness with a bent or extended integrin and the initial fractions of integrin populations in bent and extended conformations. (A) Force vs. displacement plot converted from a representative BFP force vs. time signal (insert). Two slopes can be clearly discerned in the piecewise linear curve, with the kink right on force = 0 (dashed line). (B) A schematic illustrating the slope calculations with the system under a compressive (upper) or tensile (lower) force. Slope1 and Slope2 were defined in panel (A). The equations of slope calculations were shown in corresponding panels. (C) Mean ± SEM of spring constants of the molecular complex (kmol) formed between WT αVβ3 and FNIII7-10 captured by tetrameric (WT, filled bar) and monomeric (MT, open bar) SA were compared. N.S. = not significant, assessed by unpaired, two-tailed Student’s t-test. (D) Mean ± SEM of spring constants of the molecular complex (kmol) prior to unbending (filled bars) or bending (empty bars) of the indicated integrin. * = p < 0.05, assessed by unpaired, two-tailed Student’s t-test. (E) Data (points) and Gaussian fits (curves) of kmol distributions measured from the ramping phase of BFP cycles with lifetime events during which integrin unbending (blue) or bending (orange) was observed in the clamping phase. The means of the two Gaussian distributions were indicated by dashed lines with the values annotated. Data from WT, D723R and L138I were pooled together, assuming that the two mutations had negligible effects in the integrin stiffness, as suggested by panel (D). (F-H) Histograms (bars) and dual Gaussian fits (blue and orange curves were fits to the two sub-populations; color-matched curves were fits to the whole populations) of kmol for WT (F), D723R (G) and L138I (H) αVβ3 pulled by FNIII7-10. The calculated fractions of bent and extended sub-populations returned from the dual Gaussian fitting were indicated in each panel.

