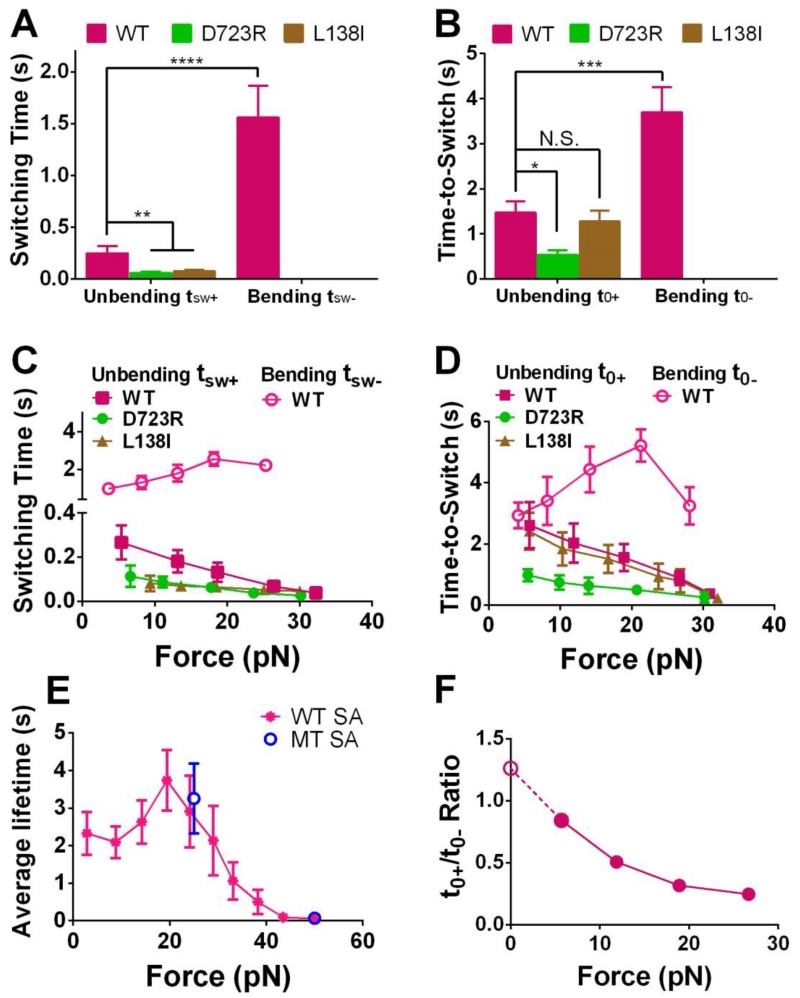
Figure 5.
Analyzing the dynamics of the integrin conformational changes. (A,B) Mean ± SEM of the switching time (tsw±, A) or time-to-switch (t0±, B) averaged over all clamping forces. (C,D) Bending (open symbols) and unbending (filled symbols) tsw± (C) or t0± (D) vs. pre-switch force curves for indicated integrins (Mean ± SEM). In A-D, bending of D723R and L138I αVβ3 occurred too infrequently to obtain sufficient data for statistically stable characterization thus were not summarized. (E) WT αVβ3-FNIII7-10 lifetime vs. force data from measurements not containing bending and unbending events, to show the potential constraints of the receptor–ligand bond lifetime to the observable tsw± (C) and t0± (D). Lifetimes of WT αVβ3 bonds with FNIII7-10 captured by monomeric SA (MT, blue) at 25 and 50 pN were compared to those by tetrameric SA (WT, magenta) over an entire force range. (F) Ratio of WT αVβ3 time-to-unbend t0+ to time-to-bend t0− vs. clamping force, showing the force-dependent bent/extended state equilibrium. The solid circles were calculated from data in panel D. The value of the open circle was the ratio of the extended to bent integrin sub-populations estimated from Fig. 4F. N.S. = not significant; * = p < 0.05; ** = p < 0.01; *** = p < 0.001 **** = p < 0.0001, assessed by unpaired, two-tailed Student’s t-test.

