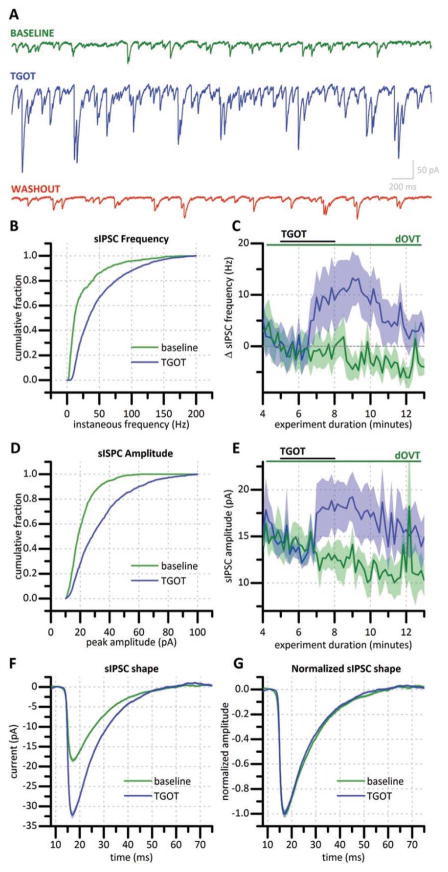
Figure 2. TGOT increases sIPSC frequency and amplitude in mossy cells.
(a) Representative current traces from a mossy cell voltage clamped at −70 mV with a high Cl− internal solution immediately before bath application of 200 nM TGOT (green trace), during maximum TGOT effect (blue trace), and 15 minutes following TGOT exposure (red trace). (b) Cumulative probability histogram showing instantaneous frequency for all sIPSCs recorded for two minutes before and two minutes following TGOT-exposure in a representative hilar mossy cell. (c) Change in sIPSC frequency produced by TGOT in the absence (blue trace, n=10) and presence (green trace, n=4) of dOVT, a selective OXT-R antagonist. (d) Cumulative probability histogram constructed using sIPSC amplitudes for all sIPSCs recorded for two minutes before and two minutes following TGOT-exposure in a representative hilar mossy cell. (e) Effect of TGOT on sIPSC amplitude averaged across 4 cells in the absence (blue trace) and presence (green trace) of dOVT. (f) Average sIPSC shape before drug application (green) and during TGOT exposure (blue) of a representative mossy cell. (g) Average sIPSC normalized to peak amplitude. Traces in (c) and (e) indicate mean (solid line) +/− standard error (shaded region). [In C and E: blue n=10, green n=8]

