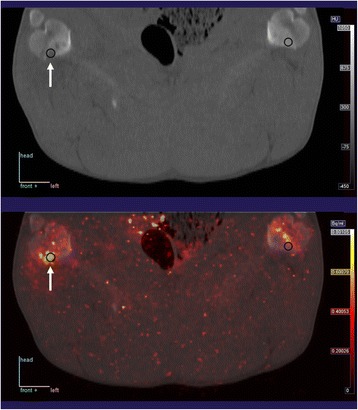
Fig. 2.

Example of lesion (arrow) and spherical VOIs drawn at the lesion and at the corresponding position in the non-infected limb. The upper image is CT, and the lower image shows CT fused with parametric image of perfusion. This is the same pig and same colour scale as in Fig. 1
