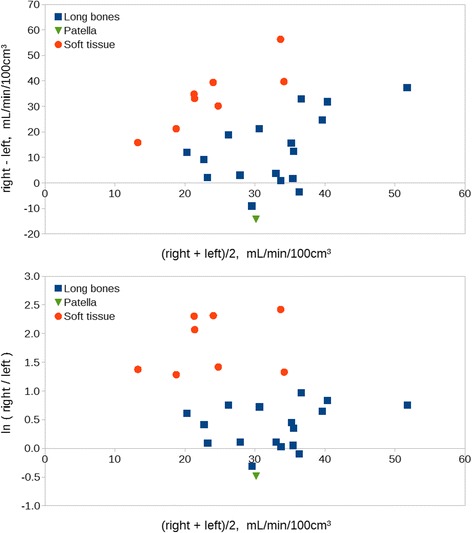
Fig. 4.

Bland-Altman plots for perfusion in long bone and soft tissue lesions. Upper: simple differences. Lower: logarithmic differences (a difference ∆ corresponds to a factor of exp(∆), e.g. exp(1.1) ≈ 3 and exp(2.3) ≈ 10). Underlying data are presented in Table 3. Note the more homogeneous spread of OM and ST in the logarithmic plot
