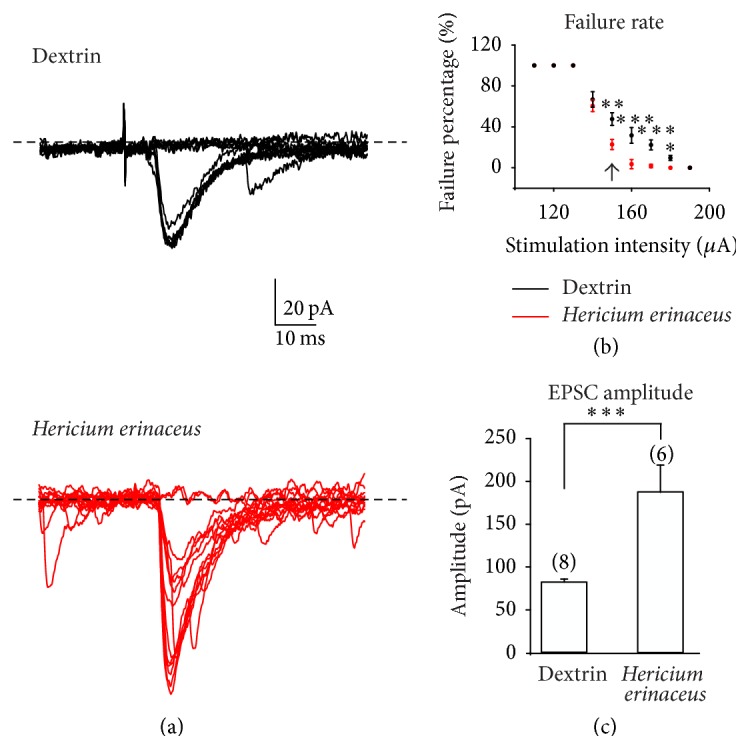
Figure 4.

Mossy fiber-CA3 synapse evoked synaptic excitatory current (EPSCs) recorded after minimal stimulation at low frequency (0.1 Hz). (a) Experimental traces of evoked synaptic excitatory currents recorded in CA3 pyramidal cells for dextrin treated mice (top, Dextrin n = 8) and H. erinaceus oral supplemented mice (bottom, Hericium erinaceus n = 6). (b) Experimental design: mossy fibers were stimulated at different intensities (15 stimulations for each point) and the percentage of failure was calculated as the number of sweeps where no EPSC was evoked over the total number of stimulations per intensity point. The arrow inside the plot indicates the intensity point at which the representative traces in (a) are taken. (c) EPSCs amplitude histogram in dextrin treated mice (Dextrin) and in H. erinaceus oral supplemented mice (Hericium erinaceus).
