
Figure 3.
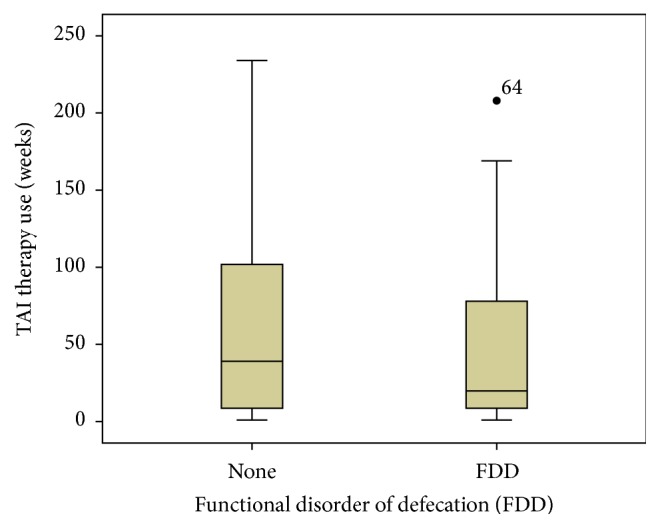
This boxplot compares the reported TAE therapy duration (y-axis, weeks) of patients classified from baseline proctograms as having a functional defecation disorder (FDD) [N = 40, mean use = 45 weeks, SD = 49.5] and no FDD [N = 36, mean use = 59 weeks, SD = 60.7], with no significant difference detected between these groups [P = 0.29].