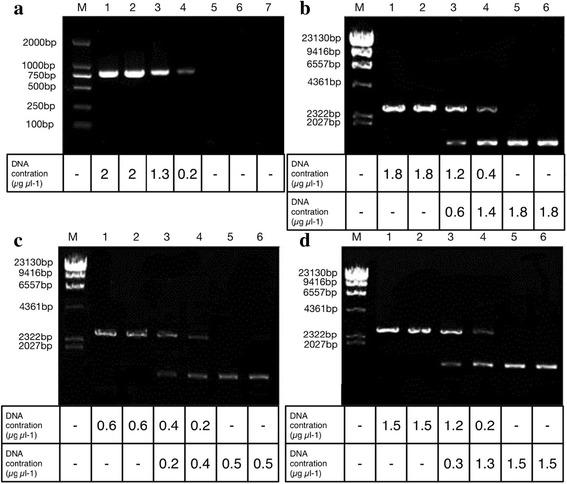
Fig. 4.

Effect of GA (C15:1) on a variety of proteins. respectively :(a) represents the effect of GA (C15:1) on the activity of Taq DNA Polymerase. The DNA contration at the bottom of fig represents the PCR reaction was inhibited by GA (C15:1). b represents the effect of GA (C15:1) on the activity of Kpn I. The DNA contration at the bottom of fig represents the enzymatic activity Kpn I was inhibited by GA (C15:1) (c) represents the effect of GA (C15:1) on the activity of Hind III. The DNA contration at the bottom of fig represents the enzymatic activity Hind III was inhibited by GA (C15:1) (d) represents the effect of GA (C15:1) on the activity of EcoR I. The DNA contration at the bottom of fig represents the enzymatic activity EcoR I was inhibited by GA (C15:1) lane 1, CK; lane 2, addition of DMSO into PCR or digestion system; lane 3, addition of 1 μg mL−1 GA (C15:1) into PCR or digestion system; lane 4, addition of 5 μg mL−1 GA (C15:1) into PCR or digestion system; lane 5, addition of 10 μg mL−1 GA (C15:1) into PCR or digestion system; lane 6, addition of 25 μg mL−1 GA (C15:1) into PCR or digestion system; lane 7, addition of 50 μg mL−1 GA (C15:1) into PCR or digestion system
