Fig. 5.

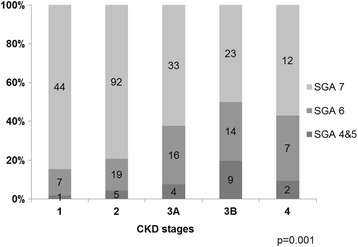
SGA score distribution according to CKD stages. P-values were obtained using the Fisher’s exact test. Bars indicate the percentage of patients in each category. CKD; chronic kidney disease, SGA; subjective global assessment

SGA score distribution according to CKD stages. P-values were obtained using the Fisher’s exact test. Bars indicate the percentage of patients in each category. CKD; chronic kidney disease, SGA; subjective global assessment