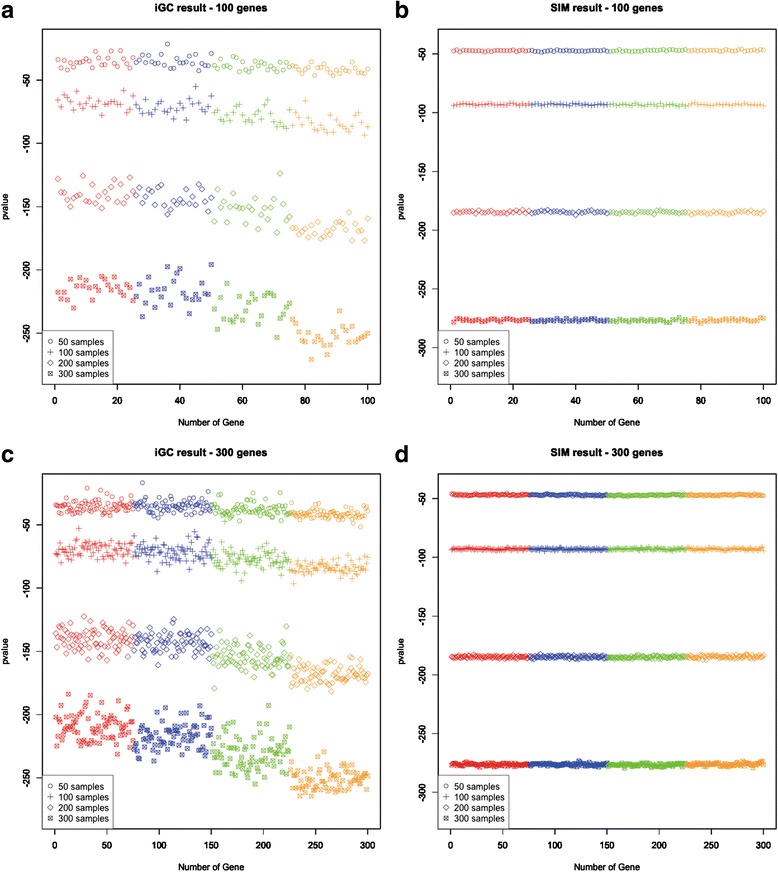
Fig. 2.

The distributions of p-values obtained from the iGC and SIM packages under different scenarios. Four sample sizes were simulated (N = 50, 100, 200 and 300) along with two numbers of genes were simulated (N = 100 for (a) and (b), N = 300 for (c) and (d)). Four groups with different Pearson correlation coefficients between CN and GE are illustrated using different colors: red, r = 0; blue, r = 0-0.3; green, r = 0.3-0.7; orange, r = 0.7-1. Each group has the same number of genes and the four groups are sorted based on the Pearson correlation coefficients
