Fig. 4.

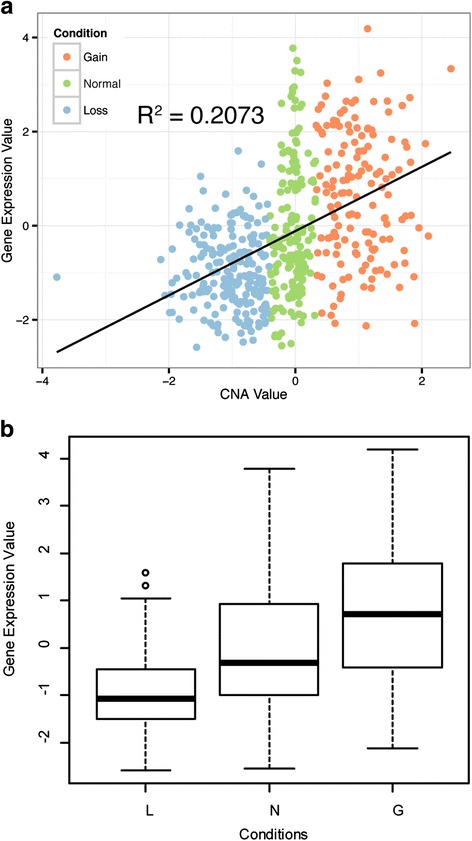
The correlation between GE and CN for the gene GSTM1 in the TCGA breast cancer dataset, presented as (a) a scatter plot and (b) a boxplot. L, CN loss; N, no gain or loss in CN; G, CN gain

The correlation between GE and CN for the gene GSTM1 in the TCGA breast cancer dataset, presented as (a) a scatter plot and (b) a boxplot. L, CN loss; N, no gain or loss in CN; G, CN gain