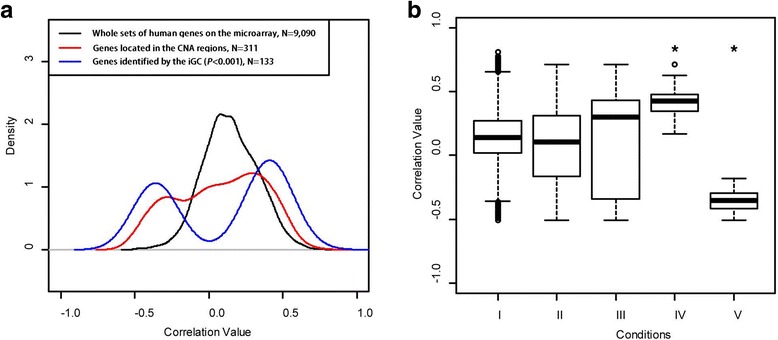
Fig. 5.

Pearson correlation coefficients between GE and CN in the lung adenocarcinoma dataset in (a) a Gaussian density plot and (b) a boxplot. Three conditions were evaluated: I) the whole set of genes on the microarray, II) the subset of genes located in the CNA regions, and III) the genes identified by the iGC package (* P < 0.001). Conditions IV and V were split from condition III, where IV) contained genes with positive correlations between GE and CNA and V) contained genes with negative correlations
