
Fig. 7.
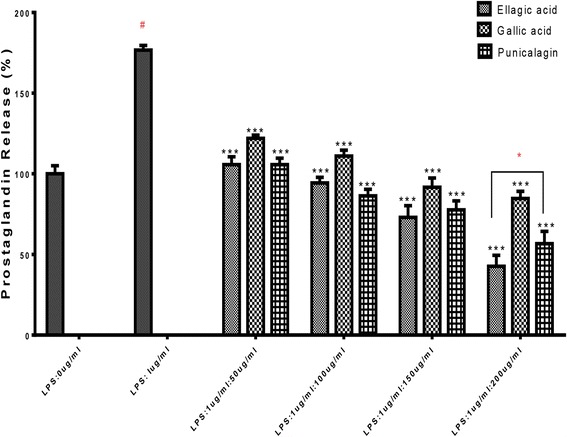
Effect of ellagic acid, gallic acid and punicalagin on PGE-2 production in LPS-stimulated RAW264.7 cells. The cells were stimulated with 1 μg/ml of LPS only or with LPS plus various concentrations (50, 100, 150, 200 μg/mL) of ellagic acid, gallic acid and punicalagin n = 3, ***p < 0.001 vs #LPS treated control* means significant difference by Tukey Kramer test