Fig. 3.

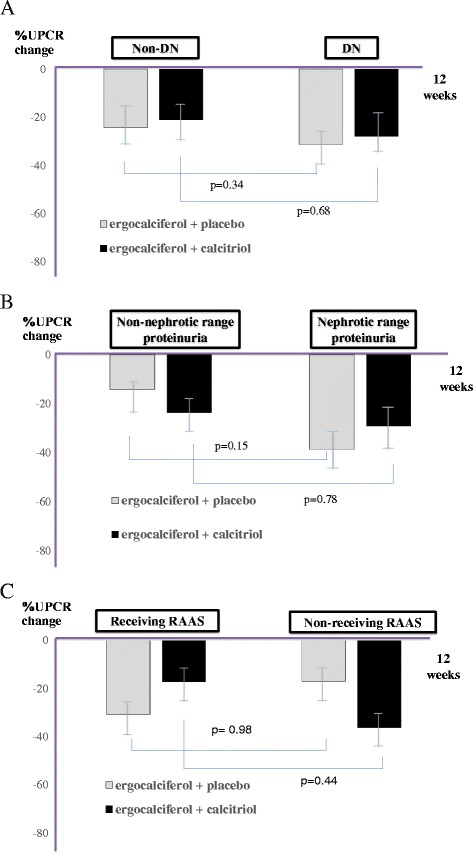
The percentage change of UPCR from baseline to 12 weeks follow-up between both groups. Subgroup analyses by cause of CKD (3A), Level of proteinuria (3B), Receiving RAAS (3C)

The percentage change of UPCR from baseline to 12 weeks follow-up between both groups. Subgroup analyses by cause of CKD (3A), Level of proteinuria (3B), Receiving RAAS (3C)