Fig. 2.

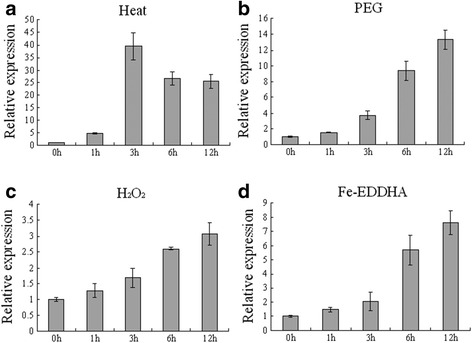
Expression pattern of TaFER-5B under heat (a), PEG (b), H2O2 (c) and Fe-EDDHA treatment (d) as assessed by RT-qPCR. The data represent the means of three replicates ± SD

Expression pattern of TaFER-5B under heat (a), PEG (b), H2O2 (c) and Fe-EDDHA treatment (d) as assessed by RT-qPCR. The data represent the means of three replicates ± SD