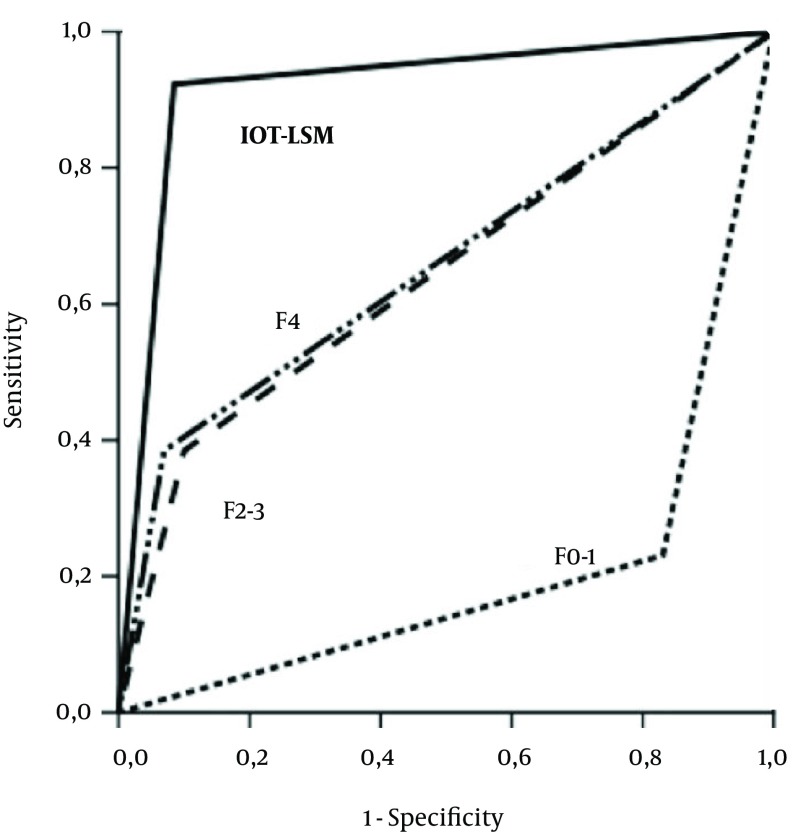
Figure 2. Area Under the Receiver Operating Characteristic Curve (AUROC) Estimates for the Presentation of Clinical Events for IOT-LSM and SOT-LSM, Subdivided in the Different Stages of Fibrosis.
IOT-LSM, increasing over time liver stiffness measurement; SOT-LSM, stable over time liver stiffness measurement; F0-1, absence or minimal fibrosis; F2-3, significant-advanced fibrosis; F4, cirrhosis.

