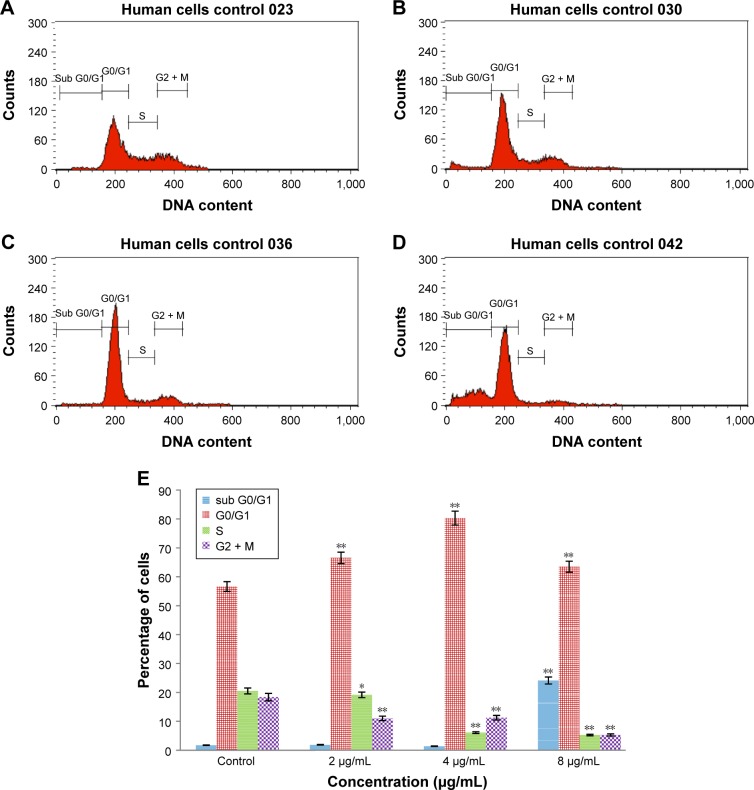
Figure 6.
Cell cycle histogram from analyses of PC3 cells treated with 0 µg/mL (A), 2 µg/mL (B), 4 µg/mL (C) and 8 µg/mL (D) of biseugenol B for 24 hours. (E) Summary of cell cycle progression for control and biseugenol B-treated PC3 cells.
Notes: The results are shown as mean ± SD of three independent experiments. *P<0.05. **P<0.005.
Abbreviation: SD, standard deviation.

