Figure 7.
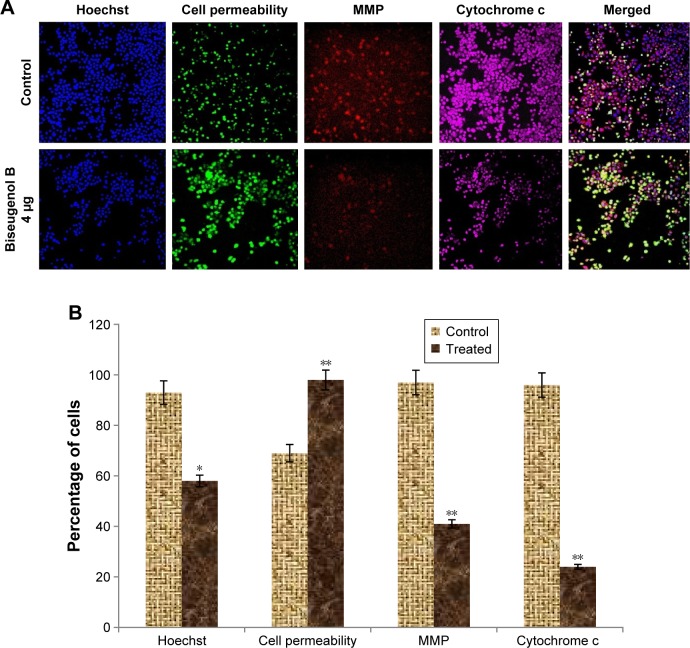
The effect of biseugenol B on nuclear size, MMP, cell membrane permeability, and cytochrome c release in PC3.
Notes: (A) Representative images of the untreated PC3 cells and PC3 cells treated with 4 µg/mL biseugenol and stained with Hoechst for nucleus, cytochrome c, membrane permeability and MMP dyes and cytochrome c dye. The images from each row are obtained from the same field of the same treatment sample (magnification ×20). (B) The bar chart represents the average fluorescence intensities of Hoechst, cell permeability dye, MMP, and cytochrome c in untreated and treated PC3 cells with biseugenol B. Data are mean ± SD of fluorescence intensity readings measured from different photos taken. *P<0.05. **P<0.005.
Abbreviations: MMP, mitochondrial membrane potential; SD, standard deviation.

