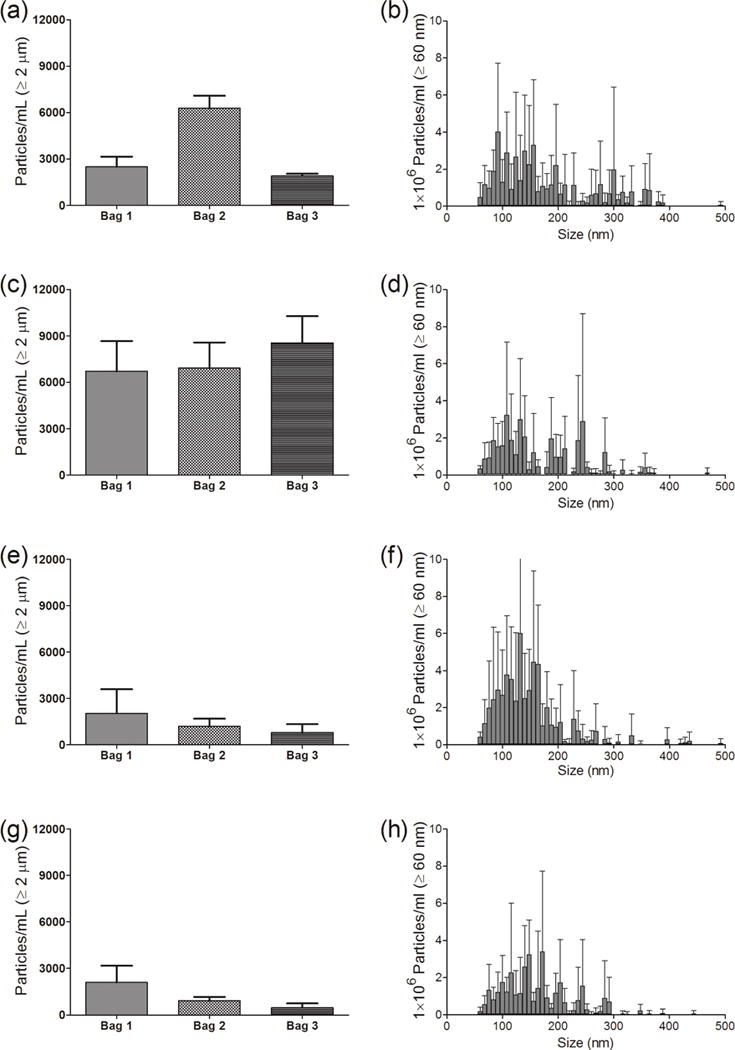
Figure 4.

Particle concentrations in IVIG diluted in IV saline bag, and after it was processed through the infusion set, with or without an in-line filter connected to the IV tube. (Left panel) -particles ≥ 1 μm from MFI analysis for IVIG samples from three individual 250 mL IV saline bags manufactured by Hospira and (right panel) - particle distribution between 60–500 nm for one representative IV bag from NTA analysis. Results are shown for: initial sample collected from the injection port of the IV bag (a and b); sample processed through the infusion set connected without a filter (c and d); sample processed with a 1.2 μm Baxter in-line filter (e and f); and sample processed with a 0.2 μm Baxter in-line filter (g and h). Error bars indicate SD for 5 independent measurements of particles in the same sample.
