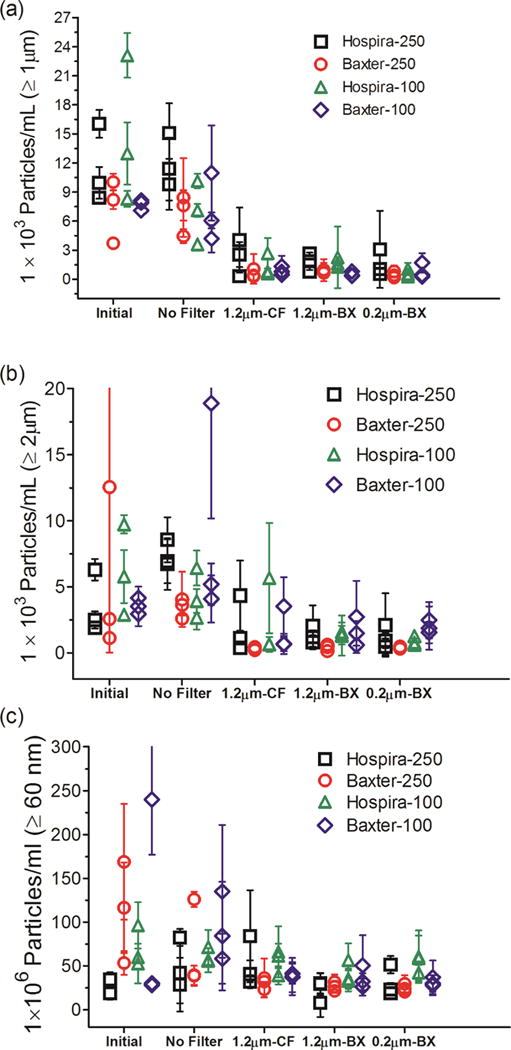
Figure 5.

Particle concentrations in IVIG diluted in IV saline bag and after it was processed through the infusion set, with or without an in-line filter connected to the IV tube. IVIG diluted into three IV bags manufactured by Hospira and Baxter in 250 mL and 100 mL volume each were tested. Total particle concentrations are shown for: ≥ 1 μm from MFI analysis (a); ≥ 2 μm from FC analysis (b); and ≥ 60 nm from NTA analysis (c). Three different in-line filters were tested with the IV tubes; 1.2 μm pore size manufactured by CareFusion (CF); 1.2 μm pore size manufactured by Baxter (BX); and a 0.2 μm pore size manufactured by Baxter (BX). Each datum point shows mean of particle counts obtained for a sample processed from one IV bag. Error bars indicate SD for 5 independent measurements of particles in the same sample.
