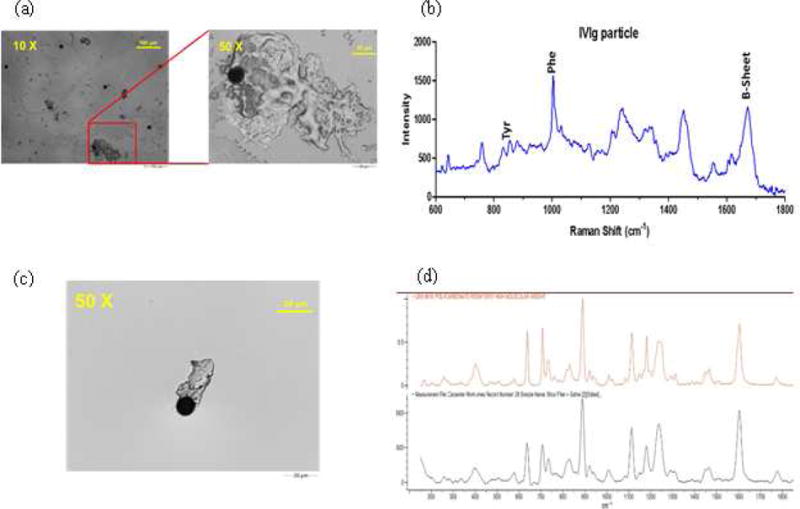
Figure 8.

Representative images and Raman spectrum obtained by Morphologi G3-ID upon analysis of IVIG processed through the IV tube connected to a 0.2μm Baxter in-line filter. Image of a protein particle (a); Raman spectrum for the protein particle (b); image for polycarbonate particle (c); and Raman spectrum for polycarbonate (d). Black spectrum is for the sample particle and orange is the reference spectrum from the Raman spectral library.
