Fig. 7.
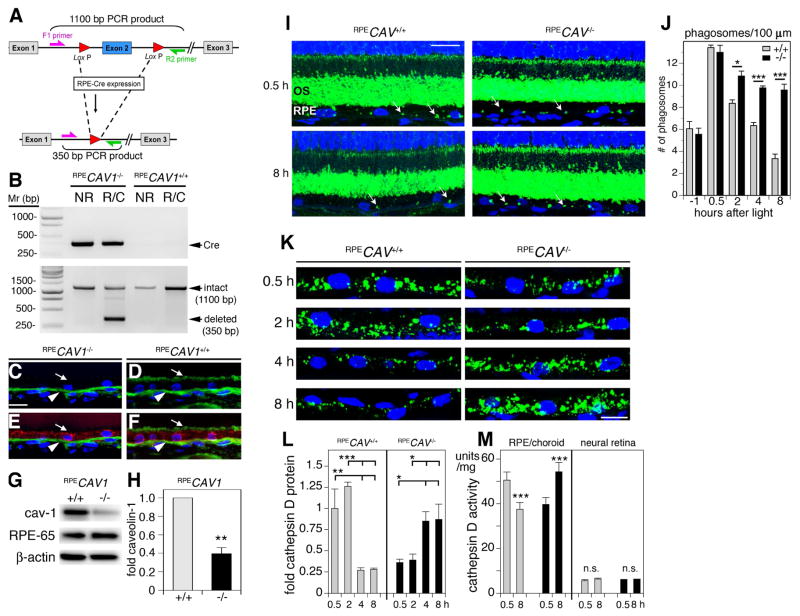
RPE-specific deletion of Cav-1 impairs phagosome clearance by RPE cells, in vivo. (A) Schematic representation of Cre/lox mediated deletion of Cav-1 via RPE-specific Cre recombinase expression. (B) Representative gel of PCR products from genomic DNA from neural retina (NR) and RPE/choroid (R/C) from littermate RPE-Cre-expressing and RPE-Cre-negative mice showing Cre (top panel) and caveolin-1 floxed products. The 350 bp CAV1 deletion product (bottom panel) is detected only in RPE/choroid from Cre-carrying mice following doxycyline induction. (C–F) Representative images showing cross sections of RPE/choroid from RPECAV1−/− (C, E) and RPECAV1+/+ (D, F) labeled with caveolin-1 (green; C–F) and RPE-65 (red; E, F). Arrows indicate apical RPE surface showing absence or presence of caveolin-1 in RPECAV1−/− (C, E) and RPECAV1+/+ (D, F), respectively. Arrowhead indicates caveolin-1 signal in the choroid. (G) Representative western blot showing RPE ablation of caveolin-1 in RPE/choroid lysates from RPECAV1+/+ and RPECAV1−/− mice. RPE-65 and β-actin are loading controls. (H) Quantification of experimental conditions as indicated in (G). (I–J) Representative images showing cross sections of retina from RPECAV1+/+ and RPECAV1−/− mice as indicated sacrificed at 0.5 h (top panels) or 8 h (bottom panels) after light onset labeled with opsin N-terminus antibody B6-30 (green) and nuclei counterstain (blue). Arrows indicate POS phagosomes residing in the RPE. ONL, outer nuclear layer; OS, outer segment layer. Bar = 10 μm. (I) Quantification of phagosome content of 100 μm-stretches of RPE counted from images and samples as shown in A. Bars show mean ± s.e.m.; n = 4 mice per group with phagosomes counted in at least 6 images per mouse. Gray bars: RPECAV1+/+ mice, black bars: RPECAV1−/− mice. (K–M) RPE-specific deletion of Cav-1 reverses the diurnal rhythm in activity of phagolysosomal enzymes in the RPE in situ. (K) Representative images showing close-up views of RPE in retina cross sections from RPECAV1+/+ and RPECAV1−/− mice as indicated sacrificed between 0.5 and 8 h after light onset as indicated labeled with cathepsin D antibody (green) and nuclei counterstain (blue). Bar = 10 μm. (L) Quantification of total cathepsin D protein levels in RPE in situ from images and samples as shown in A. Bars show mean ± s.e.m.; n = 4 mice per group with cathepsin D signal quantified in 4 images per mouse. Gray bars: RPECAV1+/+ mice, black bars: RPECAV1−/− mice. M, Comparison of cathepsin D enzyme activity at 0.5 and 8 h after light onset in posterior eyecups enriched in the RPE and neural retina as indicated from RPECAV1+/+ (gray bars) and RPECAV1−/− mice (black bars). Bars show mean ± s.e.m., n = 4 mice per condition. Reproduced from (Sethna et al., 2016).

