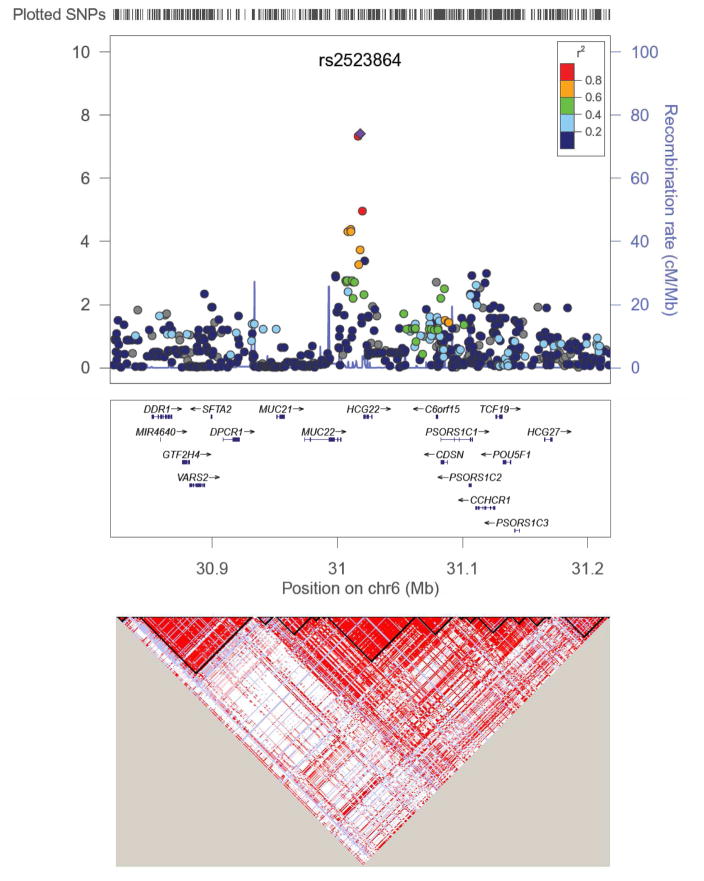
Figure 4. Regional Association Plot for lead SNP rs2523864 (marked as purple diamond) on Chr6.
All SNPs shown as circles are plotted with their respective P values against their genomic location. The solid diamond indicates the top-ranked SNP rs2523864. The colored box at the right or left corner of each plot indicates the pairwise correlation (r2) between the top SNP and the other SNPs in the region. The grey circles indicate the imputed SNPs from the CEU population of the HapMap. Each plot was created using LocusZoom (http://csg.sph.umich.edu/locuszoom/) for the top-ranked SNP in each region with a 400-kb region surrounding it. SNPs are plotted at the top of the figure. The box underneath each plot shows the gene annotations in the region, with the arrow indicated the DNA strand for transcription. The lower LD plot was created using Haploview (http://www.broadinstitute.org/scientific-community/science/programs/medical-and-population-genetics/haploview/haploview).
From: Identification of a Novel Mucin Gene HCG22 Associated With Steroid-Induced Ocular Hypertension. Jeong S, et al. Invest Ophthalmol Vis Sci. 2015 Apr;56(4):2737–48. doi: 10.1167/iovs.14-14803. Used with permission from the publisher. The authors acknowledge the Association for Research in Vision and Ophthalmology as the copyright holder.

