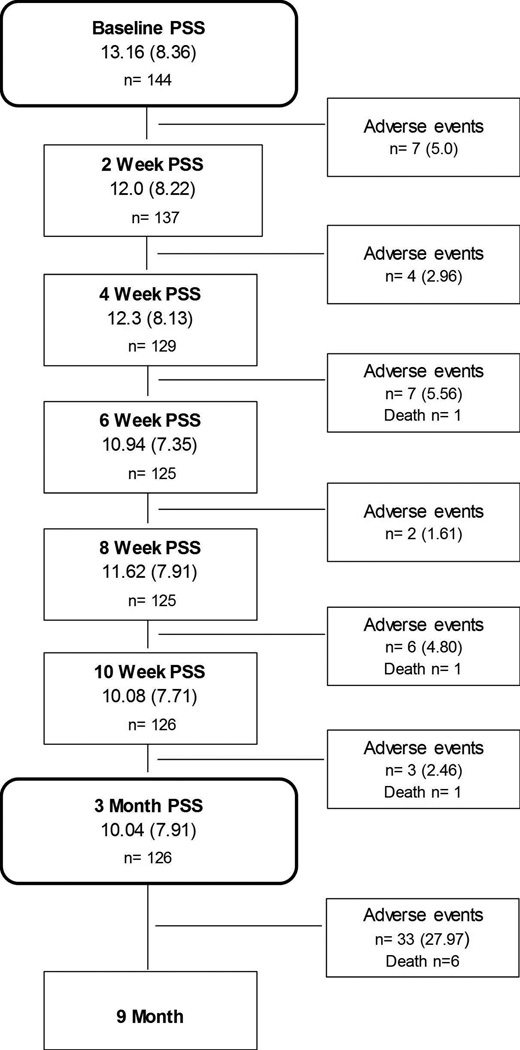
Figure 1.
Mean (SD) and sample size of patients with PSS data at each time point, and number (%) of patients experiencing at least one adverse event before the subsequent assessment.
Values are means (standard deviation) or N (%). PSS=Perceived Stress Scale. Adverse events=number of patients experiencing 1 or more cardiovascular hospitalizations or death from any cause before the subsequent assessment. 144 patients had complete data on the PSS at baseline, and 140 patients had complete data on Adverse Events.

