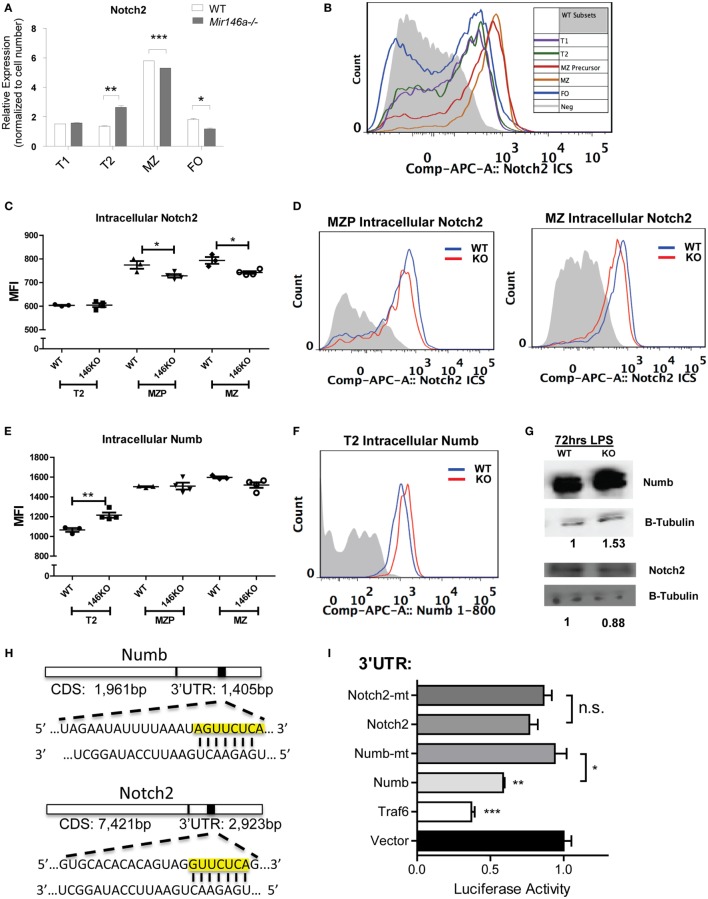
Figure 5.
Mir146a−/− B-cells show decreased Notch2 and increased Numb, a direct target of miR-146a. (A) Representative RT-qPCR quantification of Notch2 expression in splenic B-cell subsets in wild-type (WT) vs. KO (T2 **p = 0.0057, marginal zone (MZ) ***p = 0.0002, FO *p = 0.016; repeated in duplicate). (B) Representative FACS overlay of intracellular Notch2 expression in WT B-cell subsets. (C) Quantitation of median fluorescence intensity (MFI) of intracellular staining of Notch2 in T2, MZ precursors (MZP), and MZ B-cells (MZP *p = 0.035; MZ *p = 0.014; n = 3–4 mice/group, repeated in duplicate). (D) Representative overlapping histograms of Notch2 MZ subsets in WT vs. KO mice. (E) Quantitation of MFI of intracellular staining of Numb in T2, MZP, and MZ B-cells (T2 **p = 0.0083; n = 4–5 mice/group). (F) Representative overlapping histogram of T2 Numb in WT vs. KO. (G) Western blot shows increased Numb protein and decreased Notch2 protein in LPS-stimulated splenic B-cells from WT and KO mice. β-Tubulin was used as a loading control and fold change was calculated using ImageJ (repeated in duplicate). (H) Numb 3′-untranslated region (UTR) and Notch2 3′-UTR containing the putative seed sequences of miR-146a (yellow box) are shown. (I) Luciferase assays quantitating repression with MGP/miR-146a relative to MGP alone for each of the UTRs depicted. Each measurement is representative of firefly luciferase normalized to renilla luciferase and was performed in triplicate, with the experiment repeated at least three times (Traf6 vs. Vector, ***p = 0.0004; Numb vs. Vector, **p = 0.0016; Numb vs. mutated Numb, *p = 0.012; Notch2 vs. mutated Notch2). All values are mean ± SEM.

