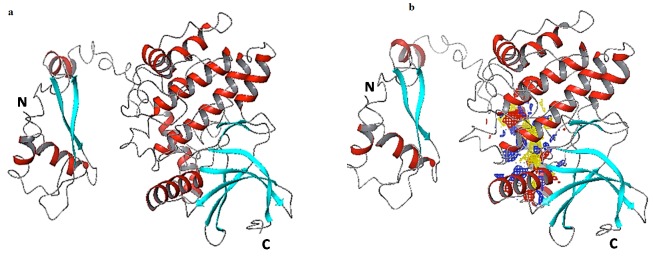
Figure 1.
a) Modeled NEK2 protein, using I-TASSER software; Visualization of modeled protein NEK2 using Maestro, depiction of secondary structures like helix (red), sheet (Cyan) and loop (Gray); b) Active site of NEK2; Ligand binding pocket of NEK2 is shown with predicted hydrophobic regions in yellow mesh, hydrogen bond donor surfaces in blue mesh and acceptor surfaces in red mesh

