Figure 1.
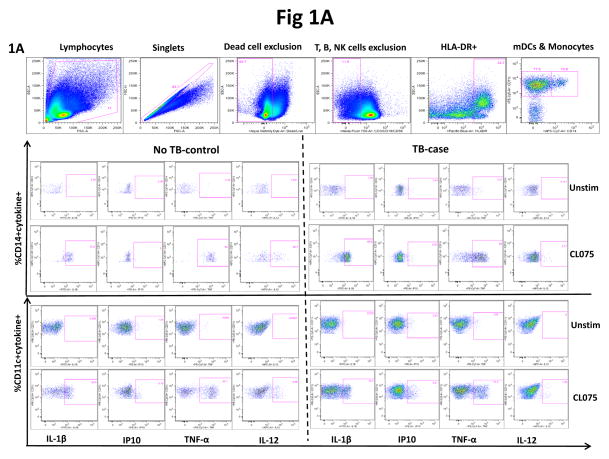
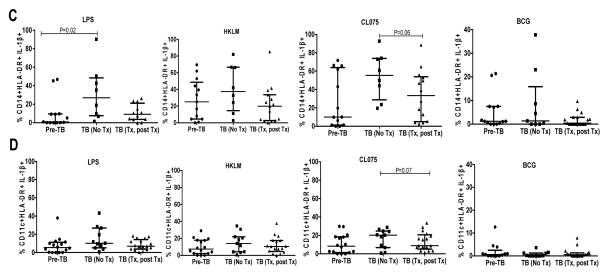
Representative gating strategy and measurement of all cytokines (IL-1β, IP10, TNF-α and IL-12) in monocytes (HLA-DR+CD11c+CD14+) and myeloid dendritic cells (mDCs; HLA-DR+CD14−CD11c+) following stimulation with TLR-7/8 ligand (CL075). (A) Gating was initially on lymphocytes followed by exclusion of cell doublets; dead cells, T cells, B cells and NK cell exclusion using the live/dead exclusion dye and CD3, CD19 and CD56 markers respectively followed by gating on HLA-DR positive cells. PBMCs were either unstimulated or stimulated with TLR-7/8 ligand (CL075) and all cytokine responses are shown for monocytes (HLA-DR+CD11c+CD14+), for first 2 rows and (mDCs; HLA-DR+CD14−CD11c+) for the last 2 rows in a control subject without TB recurrence (no TB) shown on the left panel or in an individual who experienced TB recurrence (case), shown of the right panel. Monocytes and mDC gates were each derived from the lineage negative followed by gating on HLA-DR positive cells. Initial representative gating strategy (top row) refers to an unstimulated sample. (B) Representative predictive (0–6mo & 6mo time points) cytokine (IL-1β) response profiles in monocytes (top panel) and mDCs (bottom panel) of individuals with TB recurrence (cases) during successful treatment of TB prior to TB recurrence (TB) versus controls (NTB) over time. Only cases sampled prior to TB recurrence (0–6mo & 6mo time-points) were analyzed as well as all control samples. Box and whiskers represent individual IL-1β responses in cases (red) and controls (blue, for monocytes or green for mDCs); the p-value refers to differences in IL-1β production between cases and controls at the predictive time-points (also referred to in Table 2 (monocytes) and Suppl Table 1 (mDCs) (C–D). Longitudinal assessment of IL-1β changes in monocytes (C) and mDCs (D) at pre-TB (n=16), during (n=11) and post TB (n=17) time-points in the TB recurrence group. Assessment of IL-1β changes in monocytes and mDCs of participants with TB recurrence was done using Wilcoxon matched-pairs signed ranked test. Lines represent median with inter-quartile range. Fewer time points were analyzed for monocytes compared to mDCs due to cell availability from cryopreserved PBMC.


