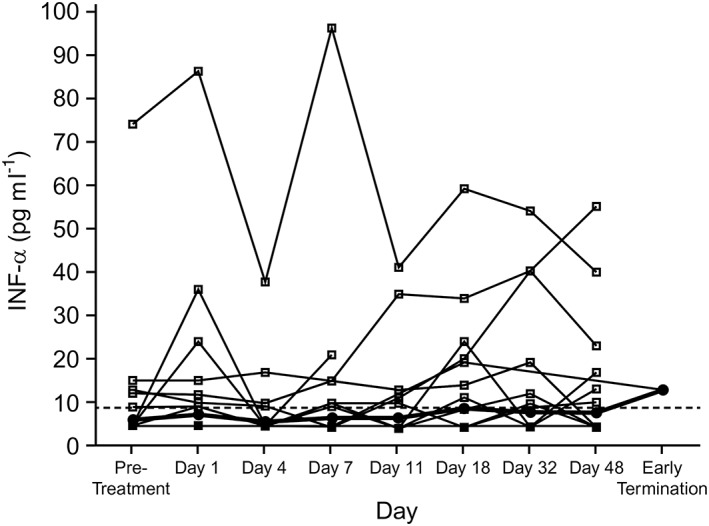
Figure 2.

Individual serum IFN‐α levels by day (all treated subjects). Dotted line represents the LLOQ (8.6 pg ml−1). Values below LLOQ were imputed as 1/2 × LLOQ. Open circles represent individual values and closed circles represent geometric mean values. IFN, interferon; LLOQ, lower limit of quantification
