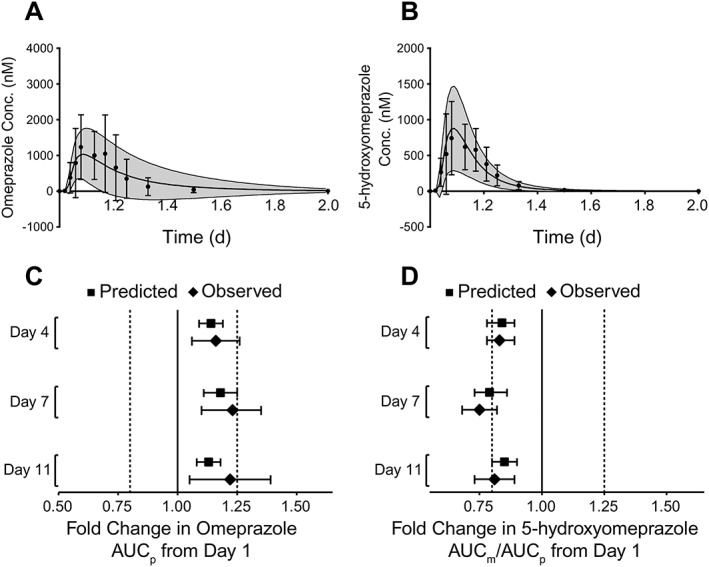
Figure 3.

Predicted and observed plasma concentration vs. time curves of (A) omeprazole and (B) 5‐hydroxyomeprazole on Day 1 for all subjects (n = 22). The predicted data are depicted as mean (solid line) and standard deviation (grey area), whereas the observed data are depicted as mean (dots) and standard deviation (error bars). Predicted vs. observed change in (C) omeprazole AUC and (D) AUC ratio of 5‐hydroxyomeprazole to omeprazole on Days 4, 7 and 11 relative to Day 1 for all subjects (n = 22). Geometric mean data with 90% CIs are shown. AUC, area under the curve; AUCm/AUCp, metabolite‐to‐parent ratio; CI, confidence interval
