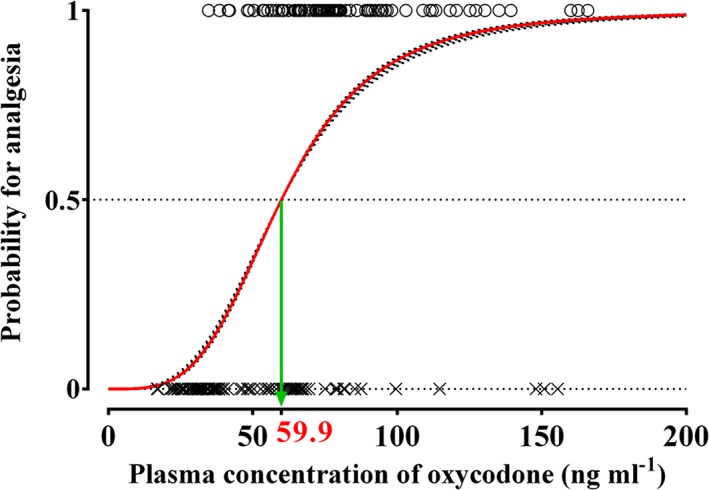
Figure 4.

Predicted probability for analgesia plotted against plasma concentrations of oxycodone in the analgesic potency study. X: plasma concentration of oxycodone at MEC (minimum effective concentration); O: plasma concentration of oxycodone at MEAC (minimum effective analgesic concentration). Red solid line indicates population prediction, and black dotted lines indicate individual prediction. The estimate of measured plasma oxycodone concentration associated with a 50% probability of analgesia (C p50) was 59.9 ng ml−1
