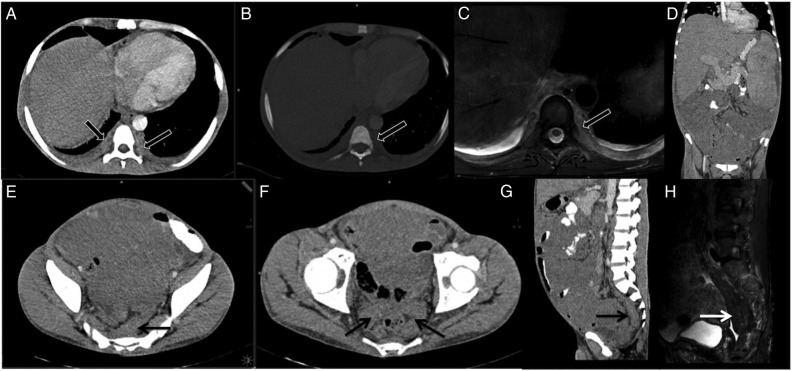
Figure 5.
(A–H): Follow-up imaging in 2016. (A–C) showing bilateral paravertebral foci of extramedullary haematopoeisis along dorsal spine and ribs (block arrows). There was no bone destruction (B) and these masses were mildly hyperintense on T2-W MRI (C). (E–H) showing presacral (arrow, (E and G)) and perirectal (arrow, (F)) soft tissue which was hypointense on T2-W MRI (white arrow, (H)) s/o fibrotic or burnt-out hematopoetic tissue. The mesenteric masses and hepatosplenomegaly and perirenal tissue were unchanged on follow-up (D). T2-W, T2-weighted image.

