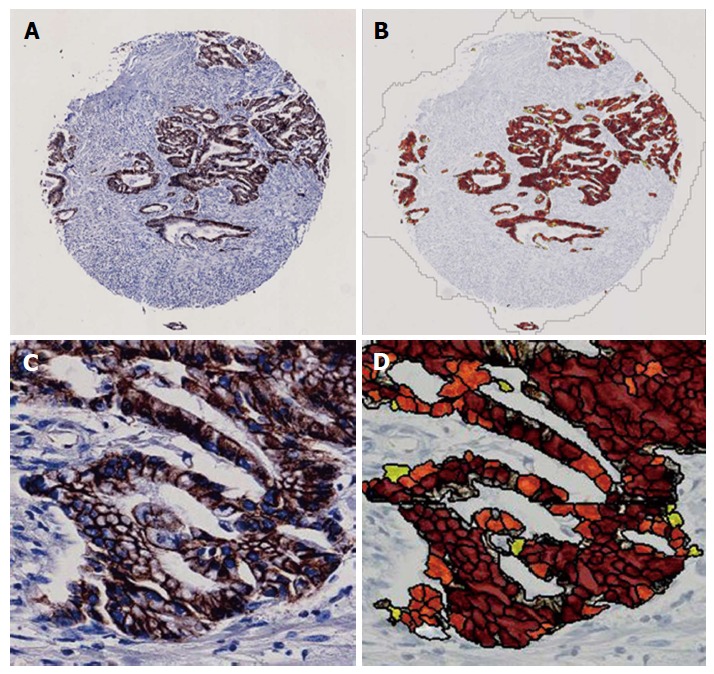
Figure 3.

Images of E-cadherin expression in cancer cells. A: Low-magnification image of an E-cadherin-immunostained TMA core; B: Low-magnification image of E-cadherin-immunostained TMA core analyzed by Tissue Studio; C: High-magnification (× 400) image of an E-cadherin-immunostained TMA core; D: High-magnification (× 400) image of an E-cadherin-immunostained TMA core analyzed by Tissue Studio. The membranous expression of E-cadherin was assigned to three categories of the degree of expression: High (brown), medium (orange) and low (yellow). The histological score was calculated by the following formula: 1 × %Low + 2 × %Medium + 3 × %High. TMA: Tissue microarray.
