
Figure 4.
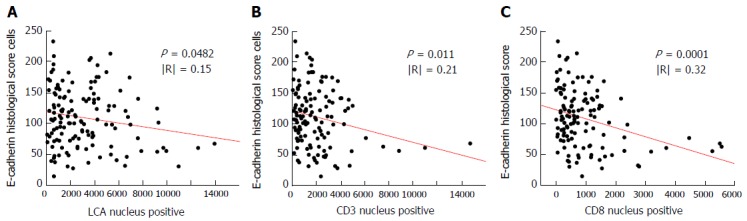
The single linear regression models of the relationship between E-cadherin expression (histological score) and the numbers of cells. The cells were positively immunostained by LCA (A), CD3 (B) and CD8 (C) antibodies.
Official websites use .gov
A
.gov website belongs to an official
government organization in the United States.
Secure .gov websites use HTTPS
A lock (
) or https:// means you've safely
connected to the .gov website. Share sensitive
information only on official, secure websites.
The single linear regression models of the relationship between E-cadherin expression (histological score) and the numbers of cells. The cells were positively immunostained by LCA (A), CD3 (B) and CD8 (C) antibodies.