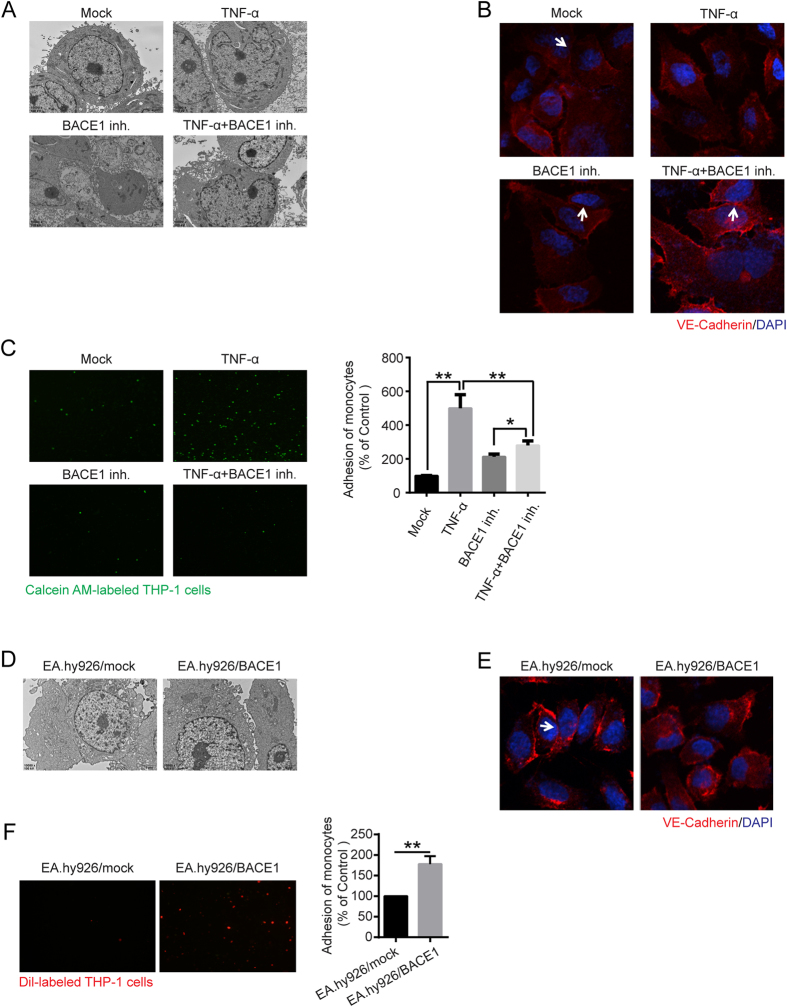
Figure 5. Tight junctions and cell adhesion were affected by BACE1.
(A) BACE1 inh. (1 μM) was administered as pretreatment for 24 h, and then the cells were stimulated with TNF-α (50 ng/mL) for 24 h. EA.hy926 cell tight junctions were detected by transmission electron microscopy (10000 × magnification). (B) EA.hy926 cell tight junctions were also detected by confocal immunofluorescence analysis using anti-VE-cadherin antibody (Red). Blue, DAPI. (C) After BACE1 inh. (1 μM) treatment, cell adhesion assay was performed in EA.hy926 cells (100 × magnification). The data are the mean ± SD of three independent assays (**p < 0.01). (D) Transmission electron microscopy analysis was used to identify BACE1-overexpressing EA.hy926 cell tight junctions (10000 × magnification). (E) Immunofluorescent analysis of the tight junction protein VE-cadherin. Red, VE-cadherin. Blue, DAPI. (F) Monocyte adhesion to endothelial cells was quantified by monocyte adhesion assay. Dil-labeled THP-1 cells were incubated with endothelial cells in 96-well plates for 1 h at 37 °C. The plates were then washed three times with PBS, and the fluorescence was measured. The data are the mean ± SD of three independent assays (**p < 0.01).

