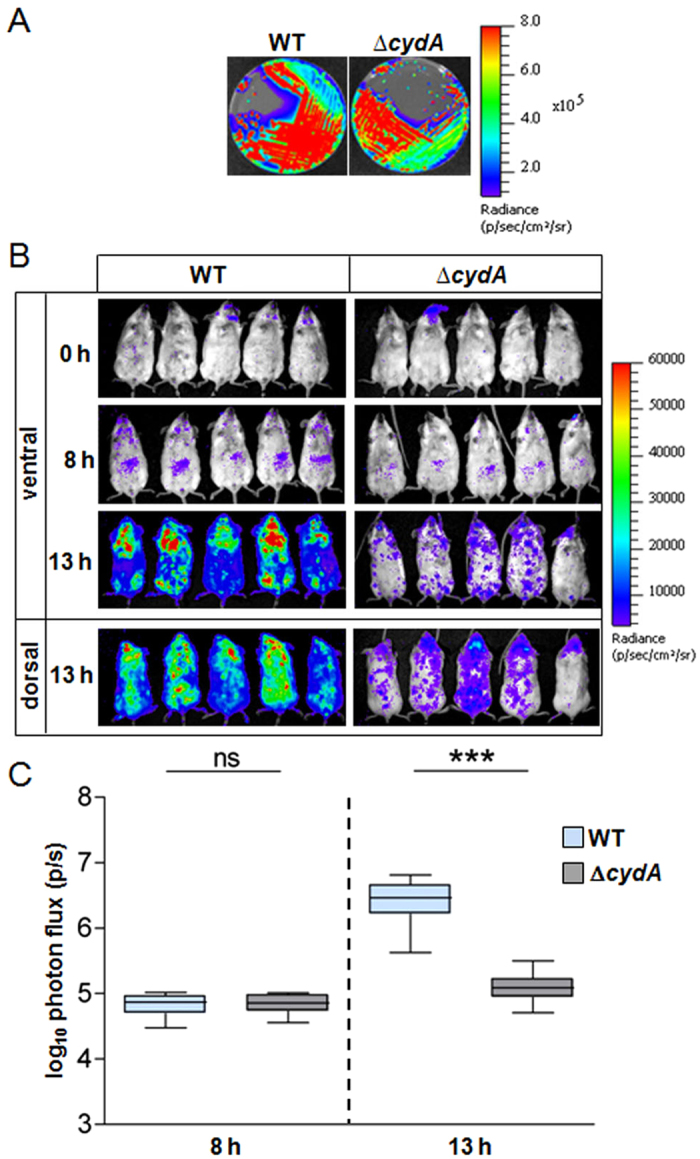
Figure 4. GBS virulence relies on host heme-activated respiration metabolism.

(A) Bioluminescence of WT(NEM316) and ΔcydA(NEMJ17) transformed with plux on agar plates. Luminescence was imaged with the IVIS 200 system (acquisition time, 1 min; binning 8) (Methods). (B) Course of infection of WT and ΔcydA GBS strains in mice. BALB/c mice were infected by intravenous injection of 2.107 CFU of luminescent WT(plux) and ΔcydA(plux) GBS strains. Animal luminescence was imaged as in Fig. 3A at the indicated time points by IVIS 200 (acquisition time, 10 min; binning 8). Five mice for each time are shown and are representative of 3 independent experiments. (C) Quantification of bioluminescence in live mice at 8 h and 13 h post-infection with WT and ΔcydA strains. Luminescence from live animals infected with WT(plux) and ΔcydA(plux) was determined as in (B). Box and whiskers plot of data from 3 experiments (corresponding to a total of n = 15 mice per time point). Two-tailed Mann–Whitney was used for data analyses: 8 h, P = 0.912; 13 h, P = 0.0001. ns, not significant (P > 0.05); ***P < 0.001.
