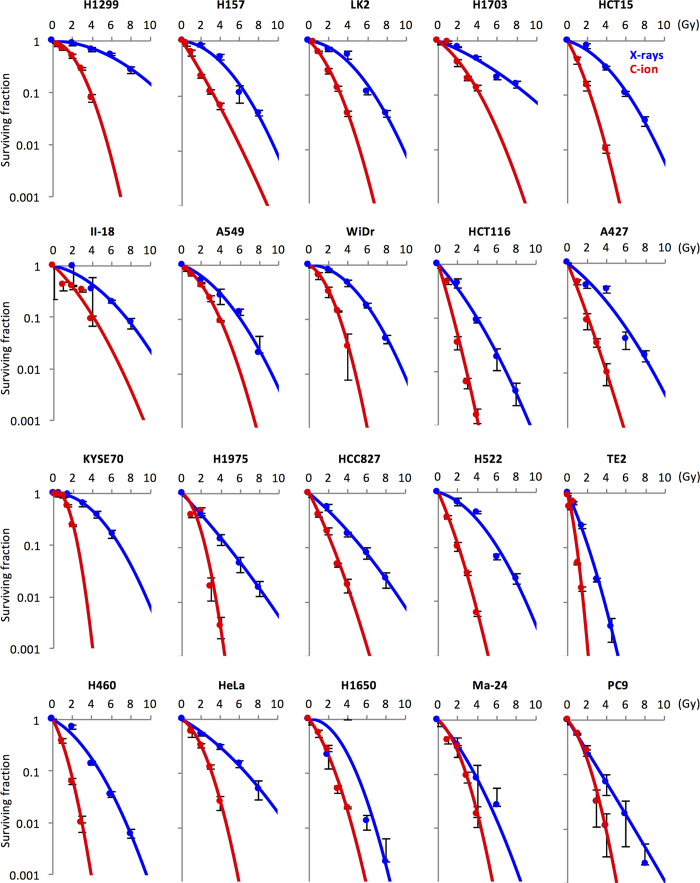
Figure 1. Sensitivity of cancer cells to X-rays or carbon ions.
Cells were irradiated with X-rays or carbon ions and subjected to a clonogenic survival assay. Experiments were performed at least in triplicate. Data are presented as the mean ± standard deviation. The survival curves were fitted to the linear-quadratic model. C-ion, carbon ion.

