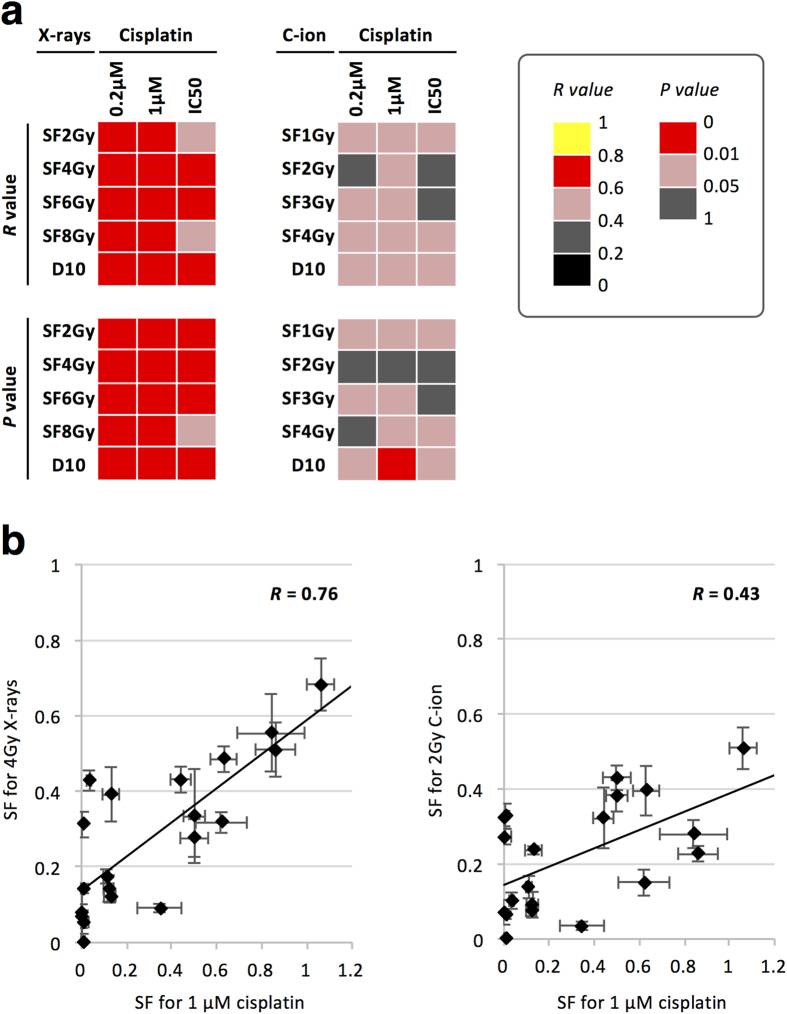
Figure 3. Correlation of the sensitivity of cancer cells to X-rays or carbon ions with that to cisplatin.
(a) Strength (R value) and statistical significance (P value) of the correlation between X-ray and cisplatin sensitivities (left panel) and that of the correlation between carbon ion and cisplatin sensitivities (right panel) as assessed by Spearman’s Rank Order test. (b) Typical example for X-rays and cisplatin (left panel) and between carbon ions and cisplatin (right panel). Data are expressed as the mean ± standard deviation. C-ion, carbon ion; SF, surviving fraction. SFXGy indicates the SF at X Gy.

