
Figure 8. Effects of PFD on hydroxyproline concentrations (n = 13 for sham group, 12 for model group, 13 for PFD group, and 13 for losartan group).
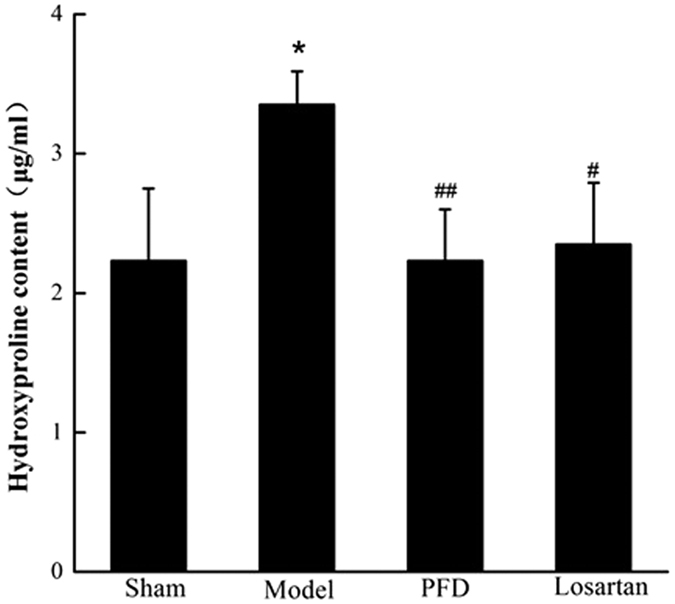
Data are reported as means ± SEM. Differences between groups were examined by ANOVA followed by Dunnett’s test. *P < 0.05 vs. sham group. #P < 0.05, ##P < 0.01 vs. model group.