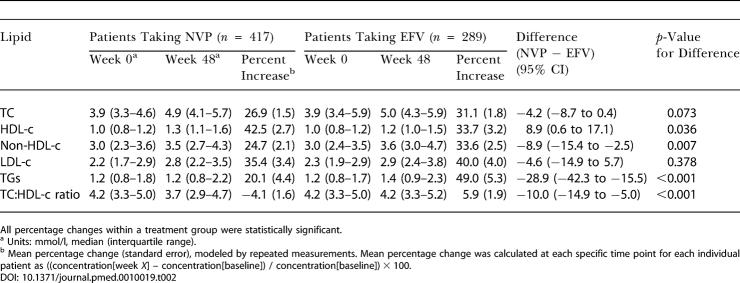
Table 2. Lipid Concentrations at Baseline and Week 48 and Mean Percentage Change.
All percentage changes within a treatment group were statistically significant
a Units: mmol/l, median (interquartile range)
b Mean percentage change (standard error), modeled by repeated measurements. Mean percentage change was calculated at each specific time point for each individual patient as ((concentration[week X] – concentration[baseline]) / concentration[baseline]) × 100

