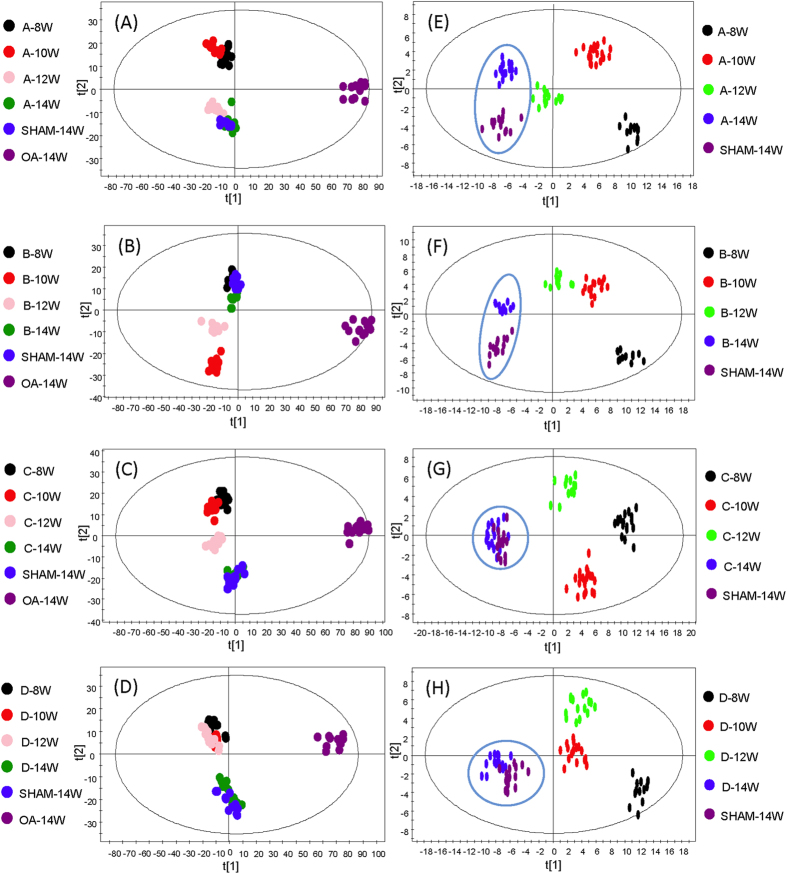
Figure 6.
OPLS-DA plots of six groups (sham at week 14, OA at week 14, and individual treatment from week 8 to week 14): (A) treatment with Drug A, (B) treatment with Drug B, (C) treatment with Drug C and (D) treatment with Drug D. OPLS-DA plots of five groups (sham at week 14 and individual treatment from week 8 to week 14): (E) treatment with Drug A, (F) treatment with Drug B, (G) treatment with Drug C and (H) treatment with Drug D.

