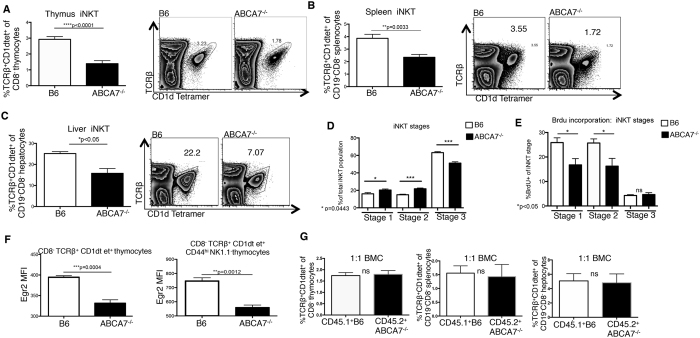
Figure 1. Impaired NKT development in the absence of ABCA7.
Frequency of NKT cells (CD8−TCRb+CD1d-tet+) in total (A) thymocytes, (B) splenocytes, and (C) hepatocytes in WT (B6) control versus Abca7−/− mice determined by flow cytometry. Representative plots shown for each; graphs represent compiled data from two separate experiments with at least four age- and sex-matched mice per group. (D) Frequency of NKT cells at each stage of development in thymus (Stage 1 CD44loNK1.1−, Stage 2 CD44hiNK1.1−, Stage 3 CD44hiNK1.1+) in WT versus Abca7−/− mice. (E) Frequency of BrdU+ NKT cells at Stages 1-3 of development in thymus analyzed by flow cytometry. (F) Mean Fluorescence intensity (MFI) of Egr2 in total NKT cells and in NKT cells at Stage 2 of development within the thymus as calculated by flow cytometry. (G) 1:1 mixed bone marrow chimeras (1:1 BMC) were generated by transferring equal numbers of CD45.1 WT control bone marrow and CD45.2 Abca7−/− bone marrow cells into CD45.1.2 irradiated hosts. NKT cell development was analyzed by flow cytometry at 12 weeks after reconstitution. Data shown are for thymocytes, splenocytes and hepatocytes, respectively. All data in Fig. 1 are representative of at least two separate experiments with at least four age- and sex-matched mice per group. Data are expressed as mean ± SEM. *p < 0.05, **p < 0.005, ***p < 0.0005, ****p < 0.00005, or ns: not significant, by unpaired, two-tailed Student’s t-test.

