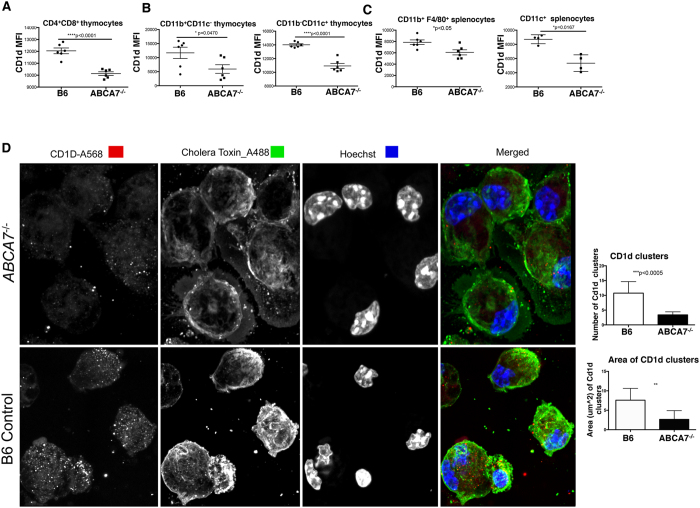
Figure 2. ABCA7 regulates CD1d surface expression and localization in lipid rafts.
(A) Flow cytometry analysis of CD1d mean fluorescence intensity (MFI) on CD4+CD8+ (double positive) thymocytes, (B) CD11b+CD11c− and CD11b−CD11c+ thymocytes from WT (B6) and Abca7−/− mice. (C) Flow cytometry analysis of CD1d MFI on CD11b+F4/80+, and CD11c+CD11b− antigen-presenting cells in spleens from WT and Abca7−/− mice. Data in Panels A–C are representative of at least 2 separate experiments with at least three age- and sex-matched mice per group. Data are expressed as mean ± SEM. *p < 0.05, ****p < 0.0001, or ns: not significant, by unpaired, two-tailed Student’s t-test. (D) Representative images of CD1d and lipid raft colocalization as measured by Cholera toxin-B staining by confocal microscopy on peritoneal macrophages harvested from WT and Abca7−/− mice. Hoechst is shown for nuclei staining. Number of CD1d clusters quantified from images from 200 cells (top bar graph). Area of CD1d clusters quantified from images of 200 cells (bottom bar graph). Data are expressed as mean ± SEM. **p < 0.005, ***p < 0.0005, by unpaired, two-tailed Student’s t-test.

