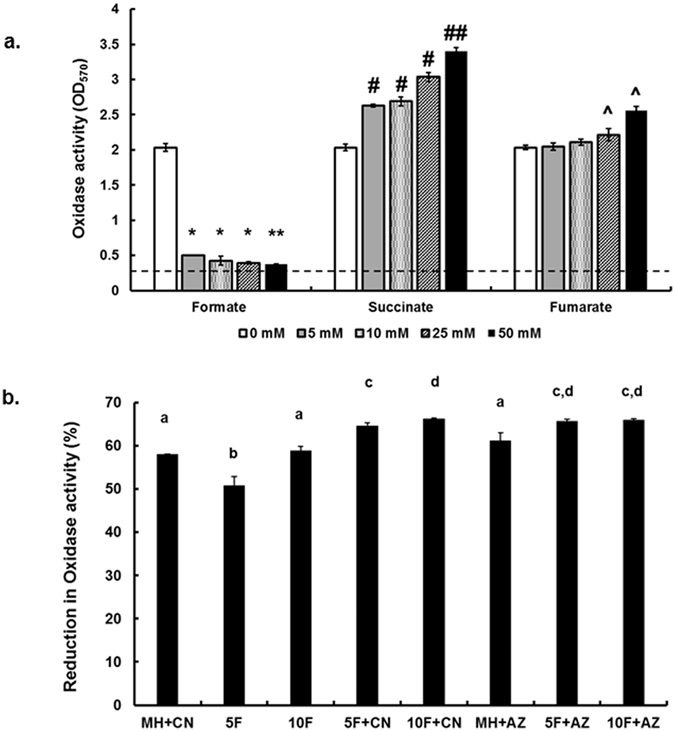
Figure 5.

(a) Oxidase activity of C. jejuni 81–176 in Mueller-Hinton broth supplemented with different concentrations of formate, succinate, and fumarate, respectively. Oxidase activity was determined using TMPD (N,N,N′,N′-tetramethyl-p-phenylenediamine), a redox indicator, which is oxidized to form a dark blue color. The colorimetric reaction was then quantified using a spectrophotometer. Symbols indicate statistically significant differences (P < 0.05) in comparison to the control (0 mM). **Denoted the lowest decrease in oxidase activity across all treatments. ##Denoted the highest increase in oxidase activity across all treatments. Horizontal dashed line indicates the lowest limit for quantification in this assay. (b) Oxidase activity in the presence of formate, sodium azide and cyanide (inhibitors of oxidase activity). CN: cyanide; AZ: azide; 5F: 5 mM formate; 10F: 10 mM formate. Different letters indicate statistically significant differences (P < 0.05). dDenotes the highest reduction in oxidase activity.
