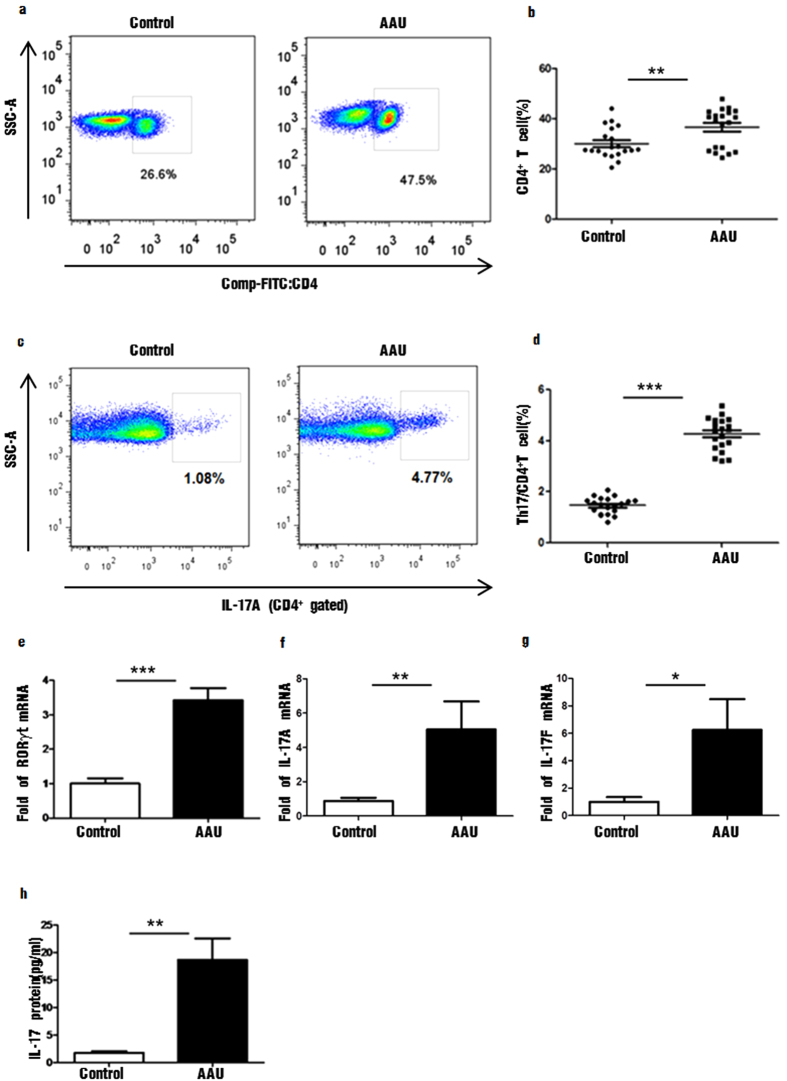
Figure 1. The distribution of CD4+, CD4+ IL-17+ cells and Th17 specific transcription factors and cytokines in peripheral blood of patients with HLA-B27-associated AAU and controls.
(a,b) CD4+ cells in control group and patients with HLA-B27-associated AAU; (c,d) CD4+IL-17A+ cells in control group and patients with HLA-B27-associated AAU (e–g). The mRNA levels of RORγt, IL-17A, IL-17F expressed by PBMC in control group and patients with HLA-B27-associated AAU (h). The protein concentration of IL-17 in the serum of control group and patients with HLA-B27-associated AAU. Data represent means ± SDs. Data were analyzed using Student’s t-test. Error bars represent s.e.m. *P < 0.05; **P < 0.01; ***P < 0.001 each control group vs HLA-B27-associated AAU patients. (AAU = acute anterior uveitis).

