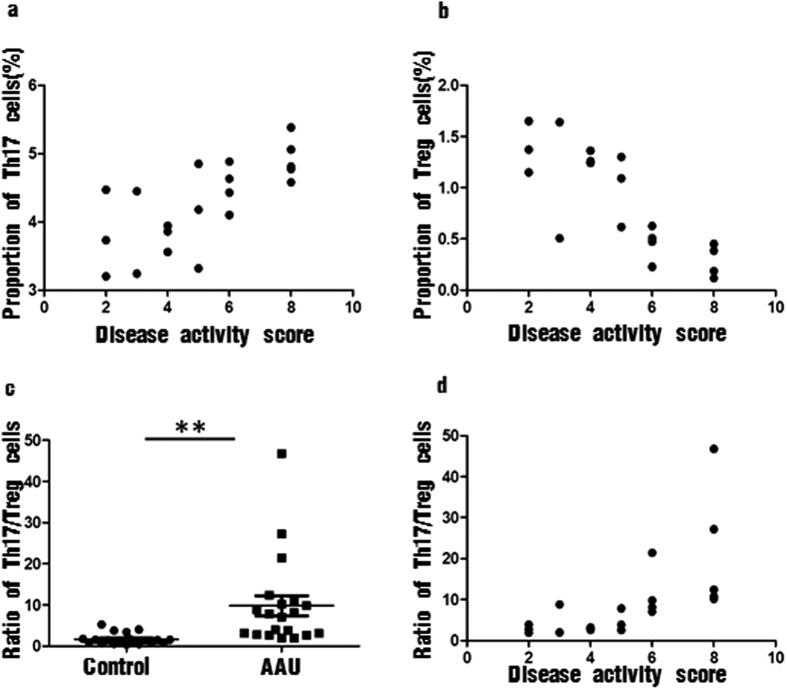
Figure 4. Correlation analysis between the proportion of the two CD4+ T cell subsets and their ratio in peripheral blood of patients with HLA-B27-associated AAU and disease activity score.
(a) Correlation analysis between the proportion of Th17 cells and disease activity score (R = 0.715, P < 0.001); (b) Correlation analysis between the proportion of Treg cells and disease activity score (R = −0.842, P < 0.001). (c) The scatter graphs to show the ratio of Th17/Treg cells in control group and patients with HLA-B27-associated AAU; (d) Correlation analysis between the ratio of Th17/Treg cells in peripheral blood of patients with HLA-B27-associated AAU and disease activity score. (R = 0.805, P < 0.001). (Spearman’s rank correlation, n = 20) (AAU = acute anterior uveitis).

