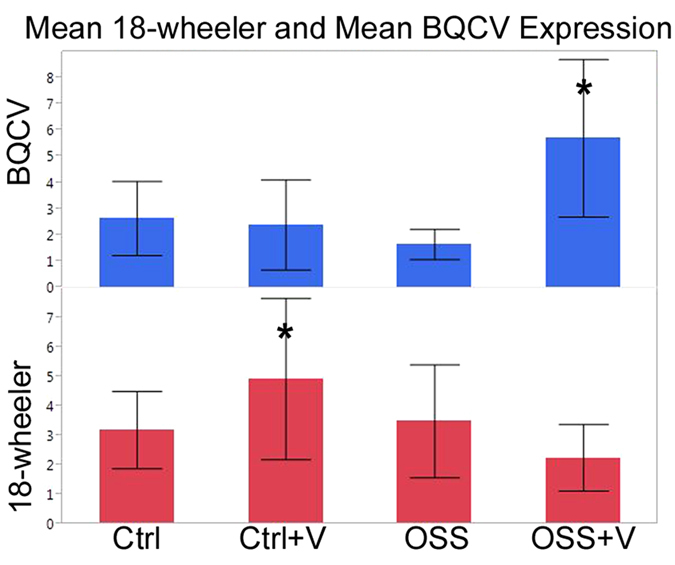
Figure 6. Expression or titers of 18-wheeler and BQCV according to treatment.

Least squares regression, n = 9–10, R2 adj. = 0.63, df = 7, p < 0.0001. Standard error indicated by error bars, Response variable significance in respective models indicated by “*”. BQCV: p ≤ 0.00053, 18-wheeler: p ≤ 0.00008.
